How do I create a Graph Slide?
Last updated: October 17, 2025
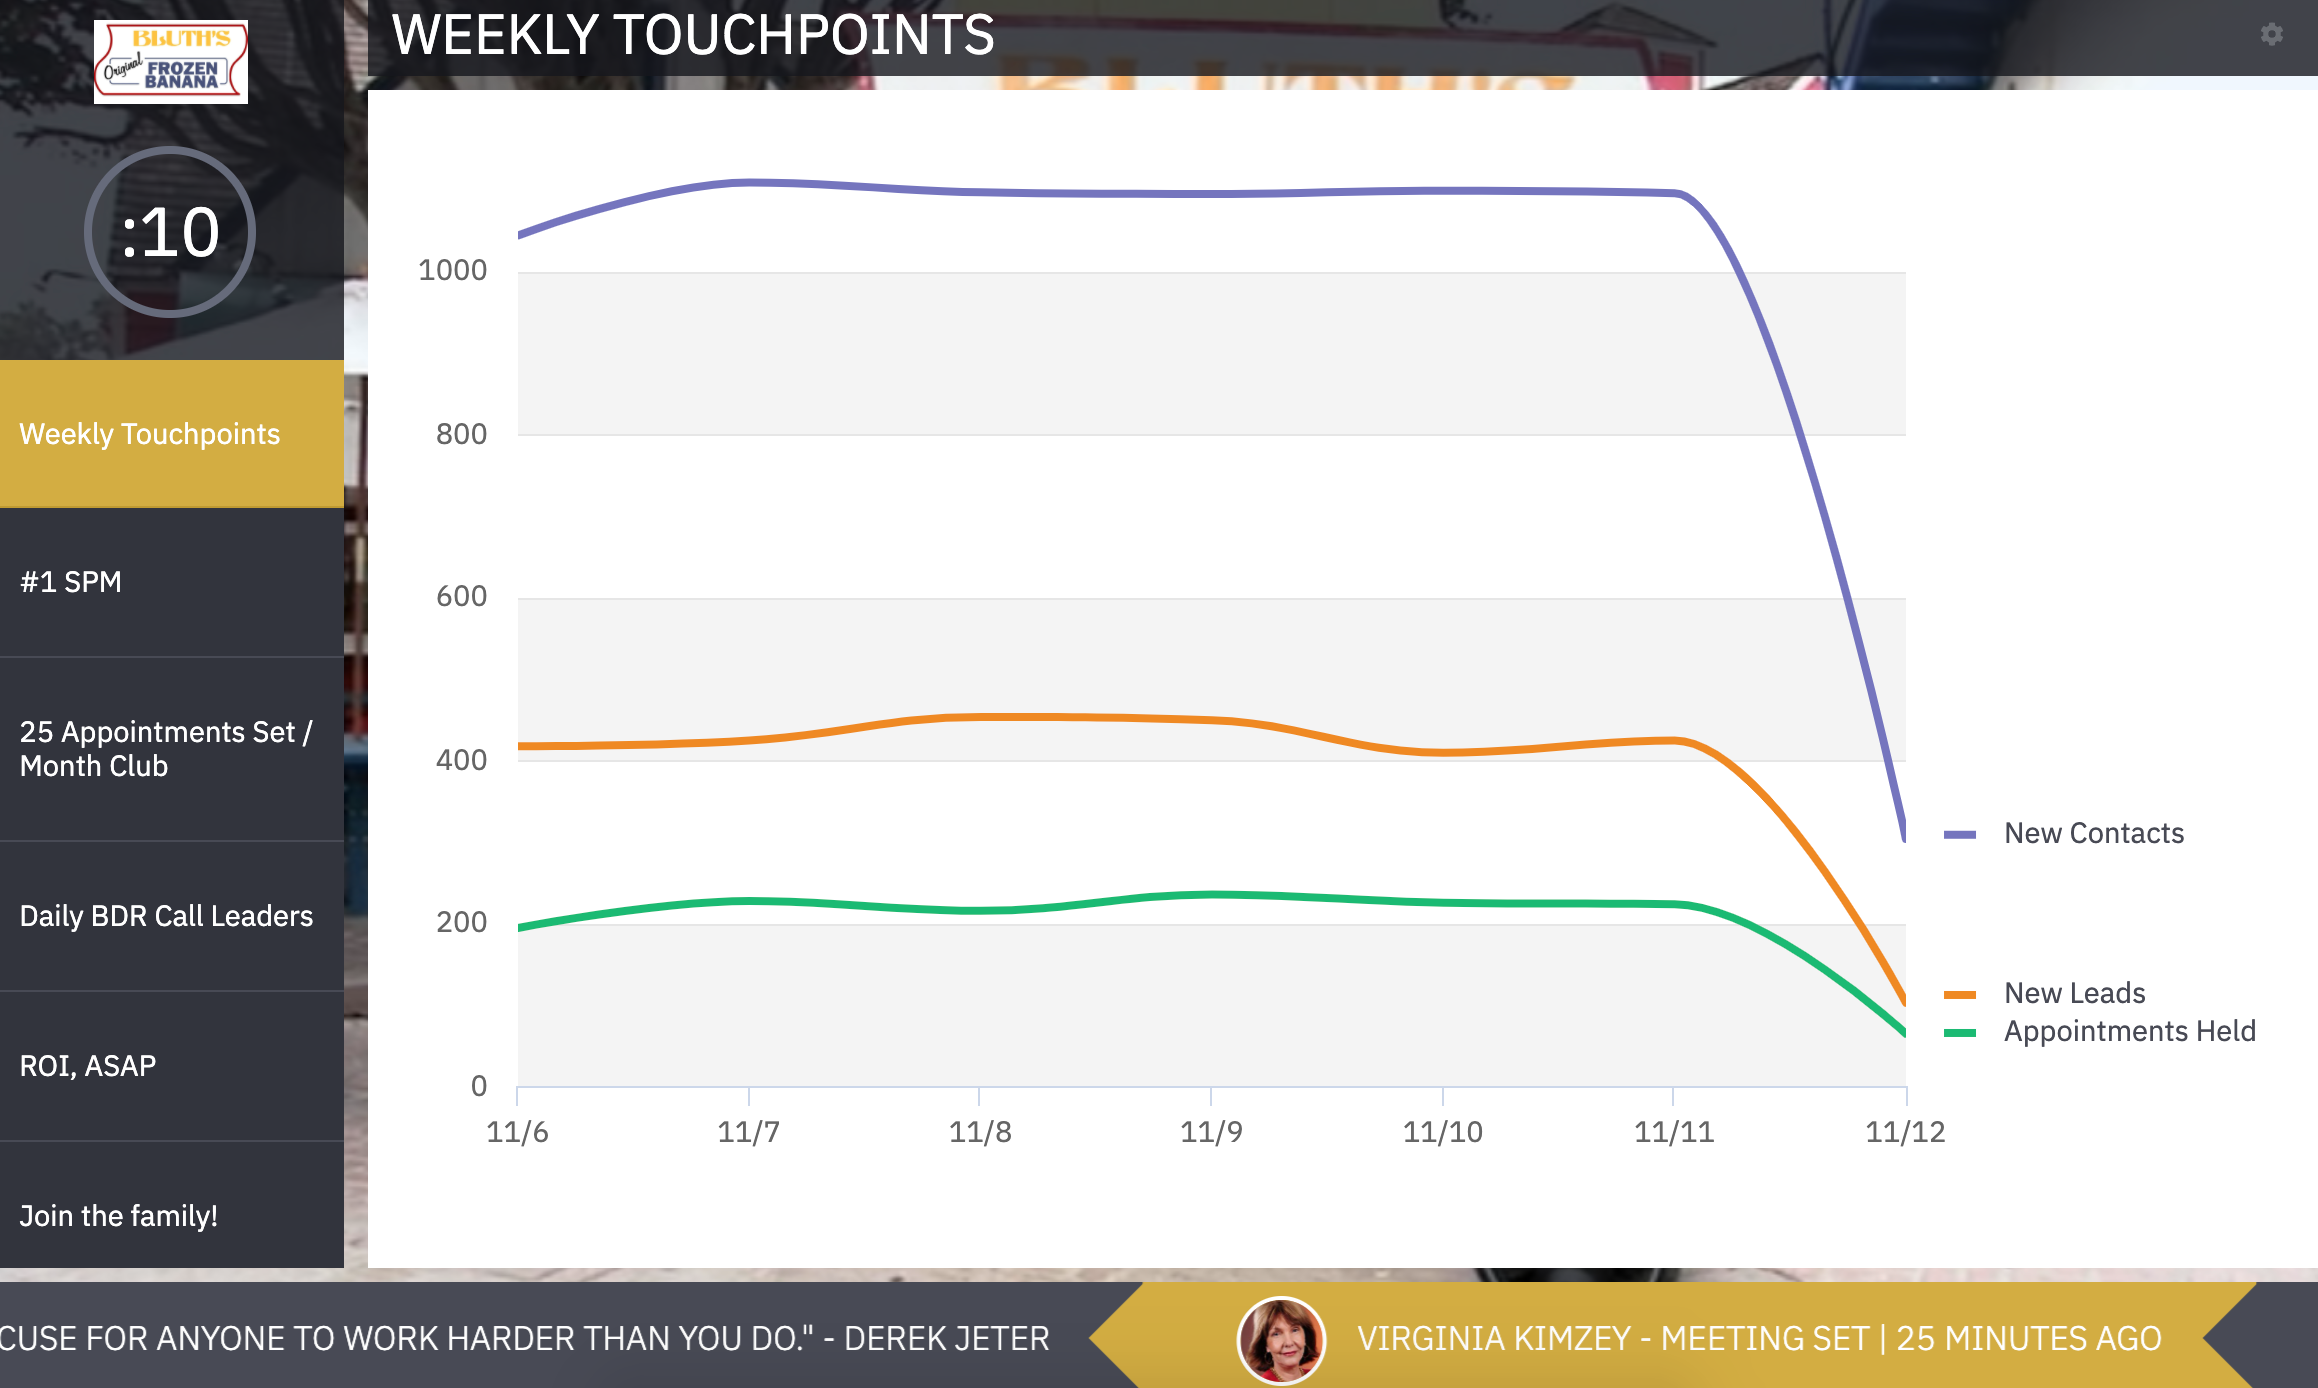
Graph Slide
Display any saved graph report, saved within analytics, directly on the TV.
Create a Graph Slide
Users with "TVs: Create" permission will be able to create, edit, and delete slides on TVs they've created.
Users with "TVs: Edit" permission will be able to create, edit, and delete slides on any TV.
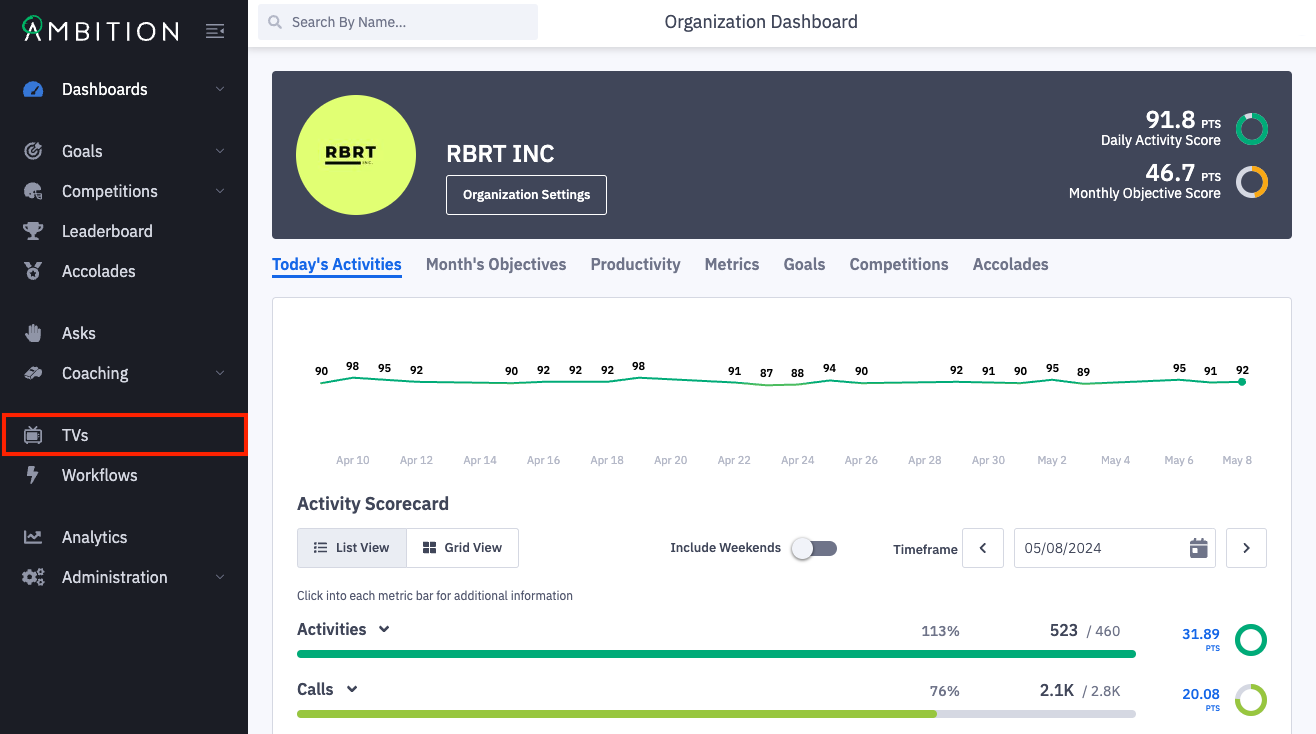
1. Open the left navigation and click TVs.
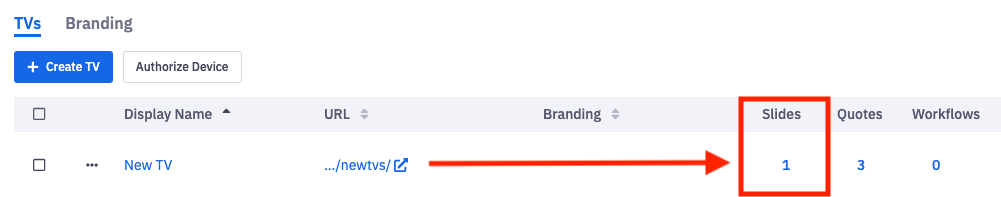
2. Click the number in the slides column on the TV you wish to edit. You can also click the ellipses icon > Edit > Slides.
Upon clicking Slides, you will see a blank Create Slide form.
3. Complete the Create Slide Form.
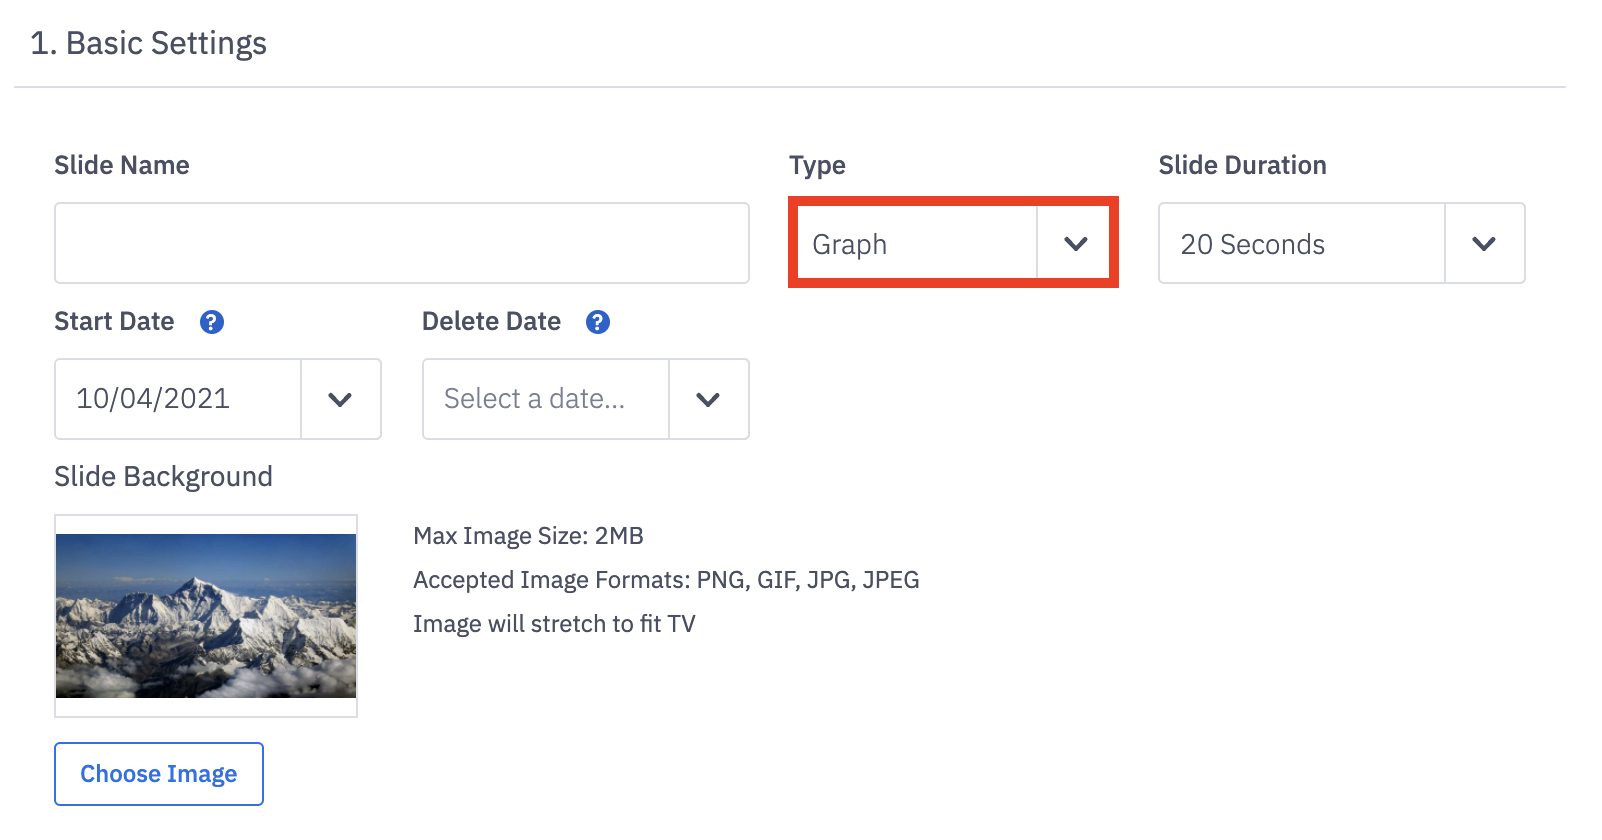
Basic Settings
Field Name | Field Description |
Slide Name | The slide name will be displayed on the TV to identify the slide. |
Type | Select Graph from the dropdown. |
Slide Duration | Determine how long this slide will be displayed per carousel rotation. Options range from 10, 20, and 40 seconds to 1, 2, 3, 4 and 5 minutes. |
Start Date | When the slide will be visible on the TV. Date defaults to today. |
Delete Date | Optional. When the slide will be removed from the TV and deleted. |
Slide Background | Optional. Upload a background image for the slide. |
Graph Setup

Select the graph to be displayed on the TV from the "Which Graph Report?" dropdown.
Only pre-saved (graph) reports will be shown in this dropdown.
Important Notes:
Within the "Which Graph Report?" dropdown, users will will only see graph reports that they saved themselves.
To ensure that the graph will update correctly, do not save the analytics graph with custom date ranges.
3. Optionally click the Preview button to preview your graph slide.
Note: Uploaded slide background images will not be viewable through the Preview option.
4. Click the Save button.