How do I save a graph report?
Last updated: June 18, 2025
Save Graph Reports
Users with the permission "Analytics Reporting: View" will be able to view all analytics data aside from saved reports created by others that are not explicitly shared with them.
The following steps assume you have already accessed the "Analytics" tab and have created a graph report. Click here to learn more about creating a graph report.
1. After creating a graph report with your desired data, click Create Report.

2. Name your report and optionally provide a description. Click Save.
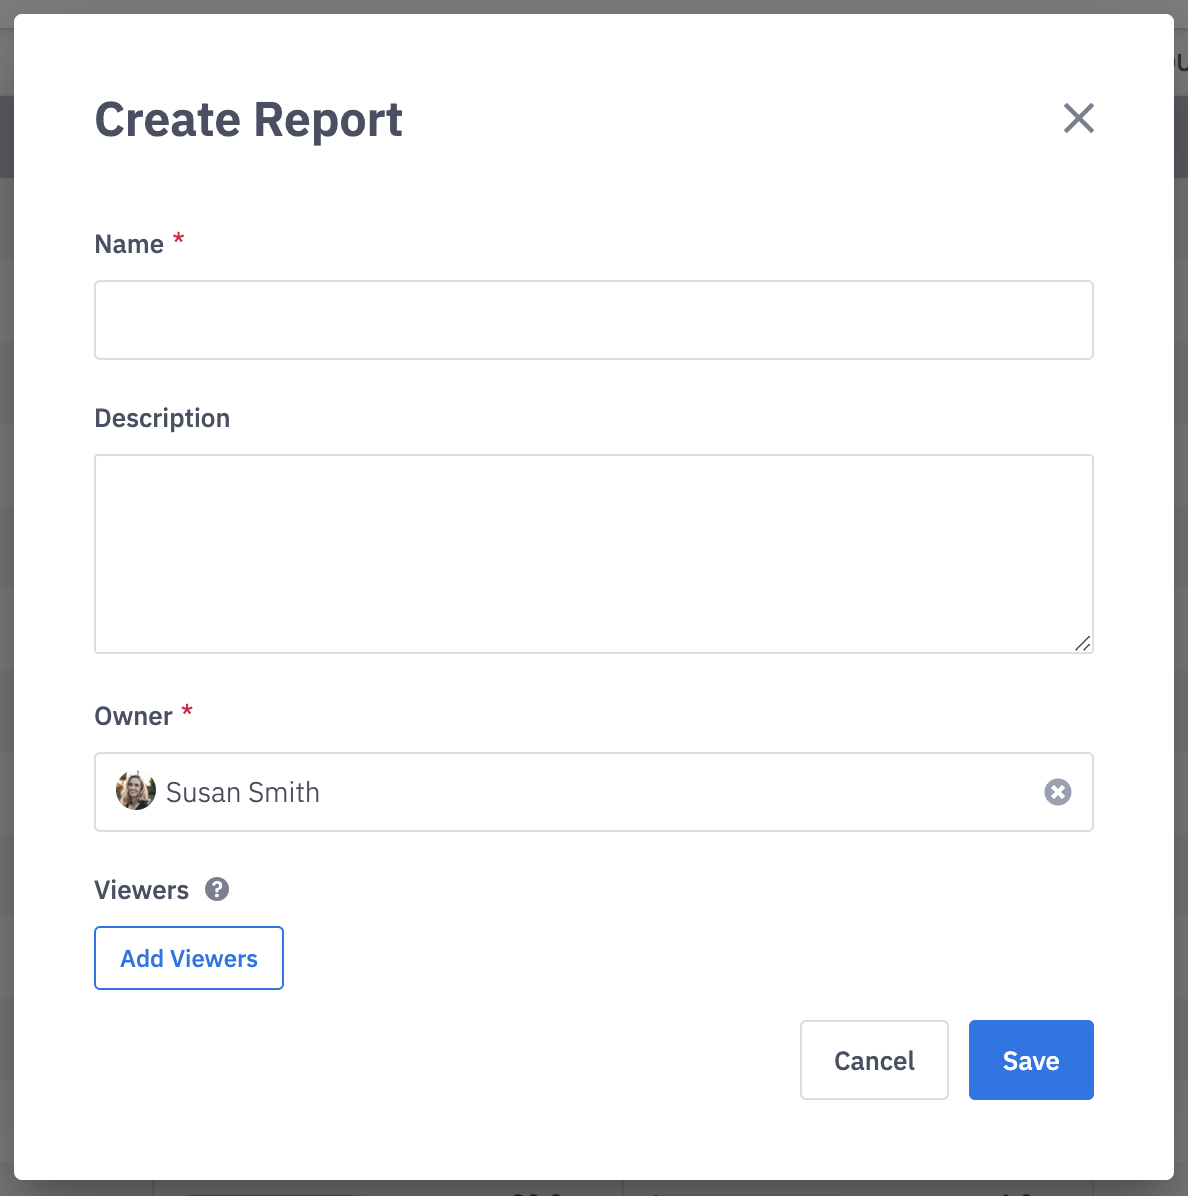
3. You can optionally change the owner or add additional viewers. Viewers will have "read-only" access to the saved report. Only users with permission to access analytics can be added as the owner or viewer.
Access Saved Reports
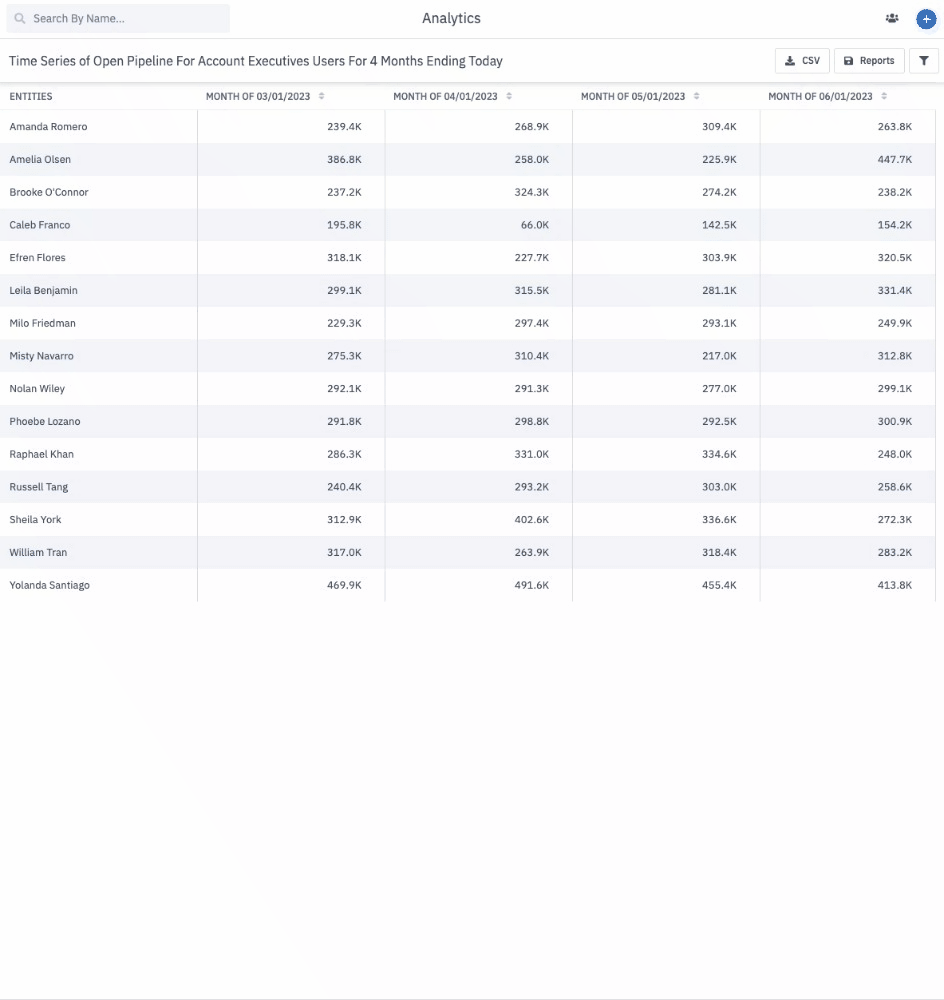
All of the saved reports you've created can be accessed through the Reports button while viewing any report type or the "Load Existing Report" dropdown through the left navigation > Analytics tab.
 Reports button | 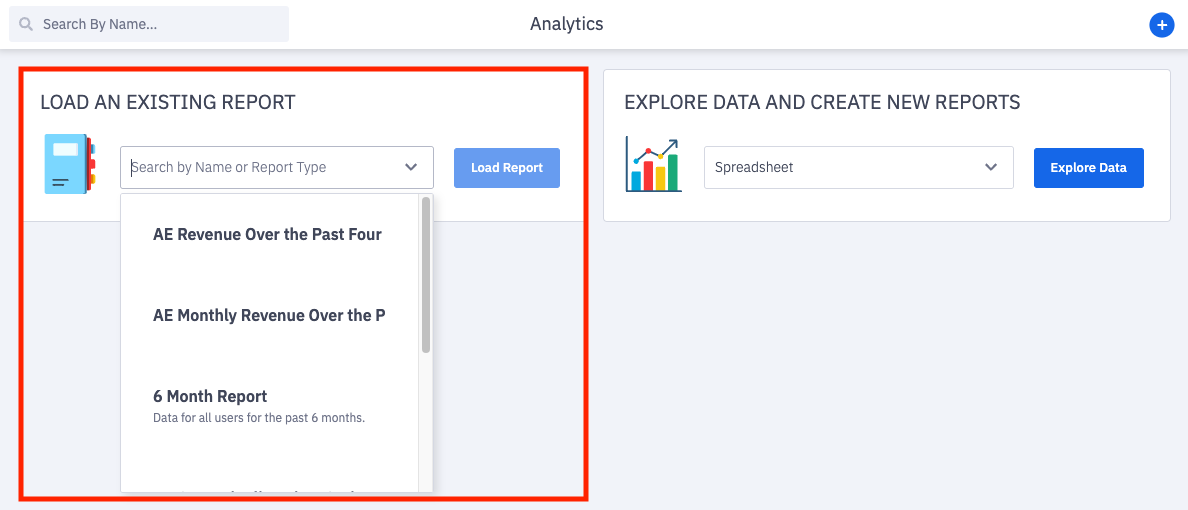 Load Existing Report dropdown |
Edit a Saved Report
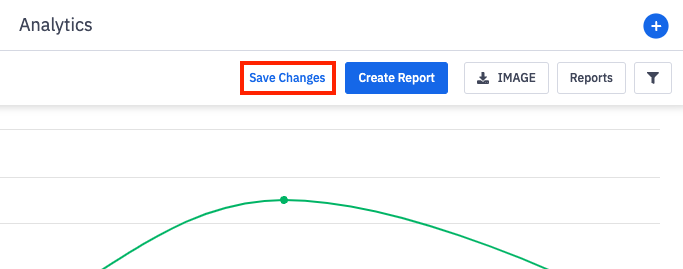
If changes are made while viewing a saved report, you will have the option to "save changes". Saving changes to your saved report will override any previous configurations of the saved report.
Save Changes as New Report
If you wish for your edits to be saved as a new report, click Create Report instead.