How do I interact with pipeline views?
Last updated: December 16, 2025
Pipeline Views
Pipeline views support selecting a "changes since" date which highlights records that have been edited, are new within the date range, or records that no longer fit the view's criteria.
Insights can be generated from the view to summarize the most important changes, and the entire view can be exported if you wish to dig into specifics
Access Pipeline Views
Accessing pipeline views is dependent on the "Pipeline Intelligence: Pipeline Views" feature being enabled.
Users with "Pipeline: Manage Views" or "Pipeline: Create Views" permission can access, view, generate insights for, and export pipeline views.
1. Open the left navigation and click Pipeline.

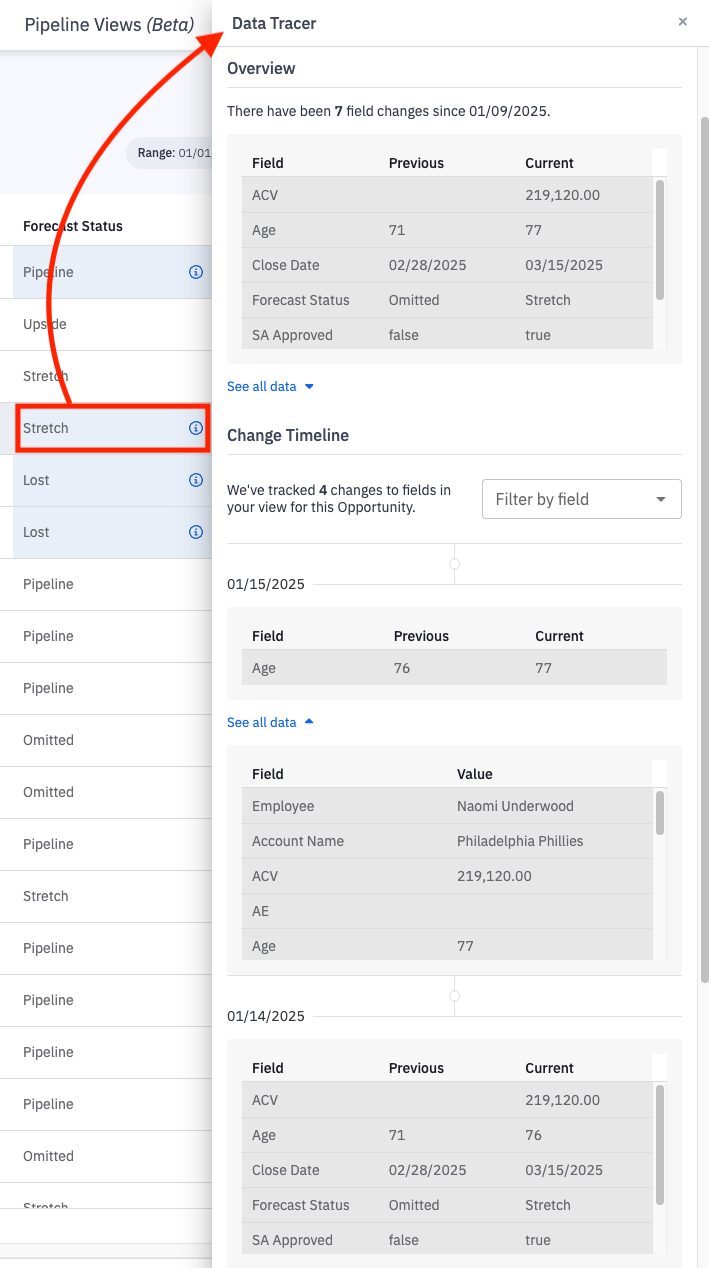
2. Click on the name of the view you wish to view.
Not seeing any views? Learn more about creating a view here.
How do I know a record has changed?
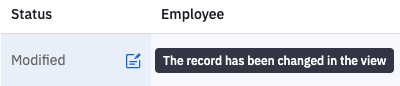
If a record within the view has changed, it will feature the word "modified" in the "Status" column and an icon with a pencil.
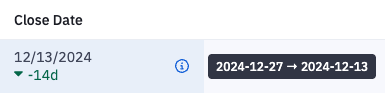
If a field in a record has been edited, the background of that field will be blue and there will be a supporting tool tip that when hovered over will show the previous and current value.
Clicking on a modified cell will open the change history, as available, for the modifications.
How will I know a record is new?
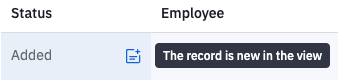
If a record in new to the view, it will feature the word "added" in the "Status" column and an icon with a plus sign.
A record could be new due to it's recent creation, it now fitting the logic filters of the view, or being moved into the date range that's being viewed, ex. potential Close Date was moved into this month and now fits the view's date range.
How will I know a record has been removed?
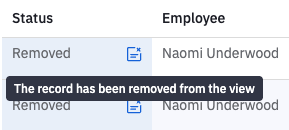
If a record has been removed from the view, it will feature the word "removed" in the "Status" column and an icon with an x.
A record could be removed due to it no longer fitting the logic filters of the view or being moved outside of the date range that's being viewed, ex. potential Close Date was moved into next month and no longer fits the view's date range.
How do I generate insights?
Don't want to explore the view for changes? Generate insights and have the notable edits and changes surfaced to you.
Click the Insights button to generate insights for the view.

Insights will be populated based on the records in the view.

Clicking on any of the blue text within the insights panel will pull up the exact record(s) being referenced in the insight for easy access.
Want detailed change insights like in the example above?
To populate information insights around stage changes, open and closed pipeline, and more, click on the gear icon within the insights panel and input any of the additional insights fields which will help provide even richer insights. Opt out of any insights by toggle off any of the options in the enabled insights panel.
Click apply to view your enriched insights.
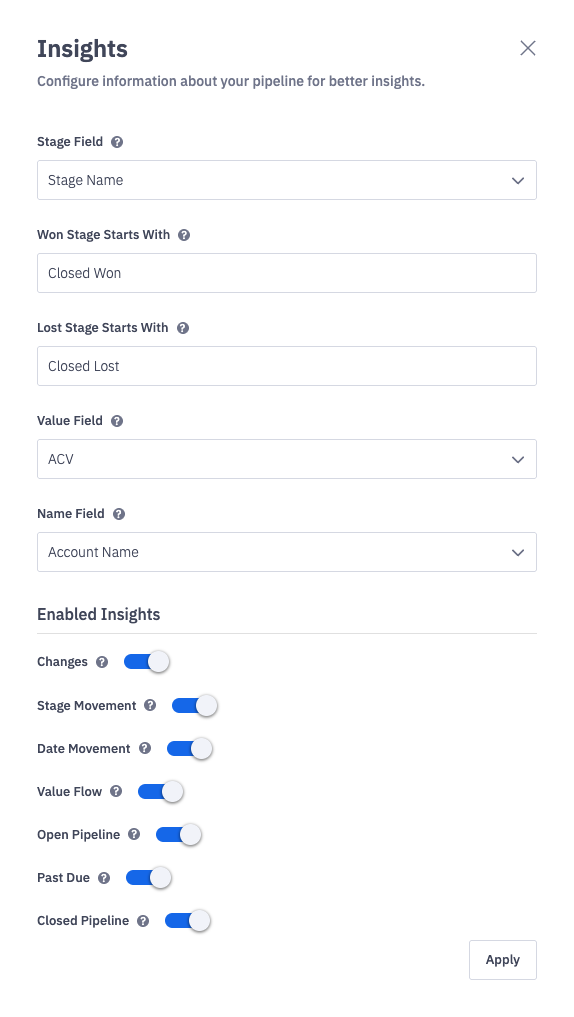
Example of Insights Settings
If you enable the "date movement" insight, pushed, pulled and slipped insights are defined as:
Pulled - the date in the selected date field has moved into the view's date range, ex. viewing records with a close date of this month and the close date is moved from the 15th of next month to the 30th of this month.
Pushed - the date in the selected date field has moved to a later date within the view's date range, ex. viewing records with a close date of this month and the close date is moved from the 1st to the 15th.
Slipped - the date in the selected date field has moved out of the view's date range, ex. viewing records with a close date of this month and the close date is moved from the 15th of this month to the 30th of next month.
How do I export the view?
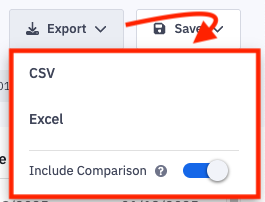
Click Export and select how you wish to have the data formatted: CSV or Excel.
Additionally, select if you would like to exclude comparison data from the export. By default, the export will contain two columns, one containing the previous value and one containing the current value, for every column that's a part of the pipeline view.
The export has a max of 10,000 rows.