How do I create a Metric Slide?
Last updated: October 17, 2025
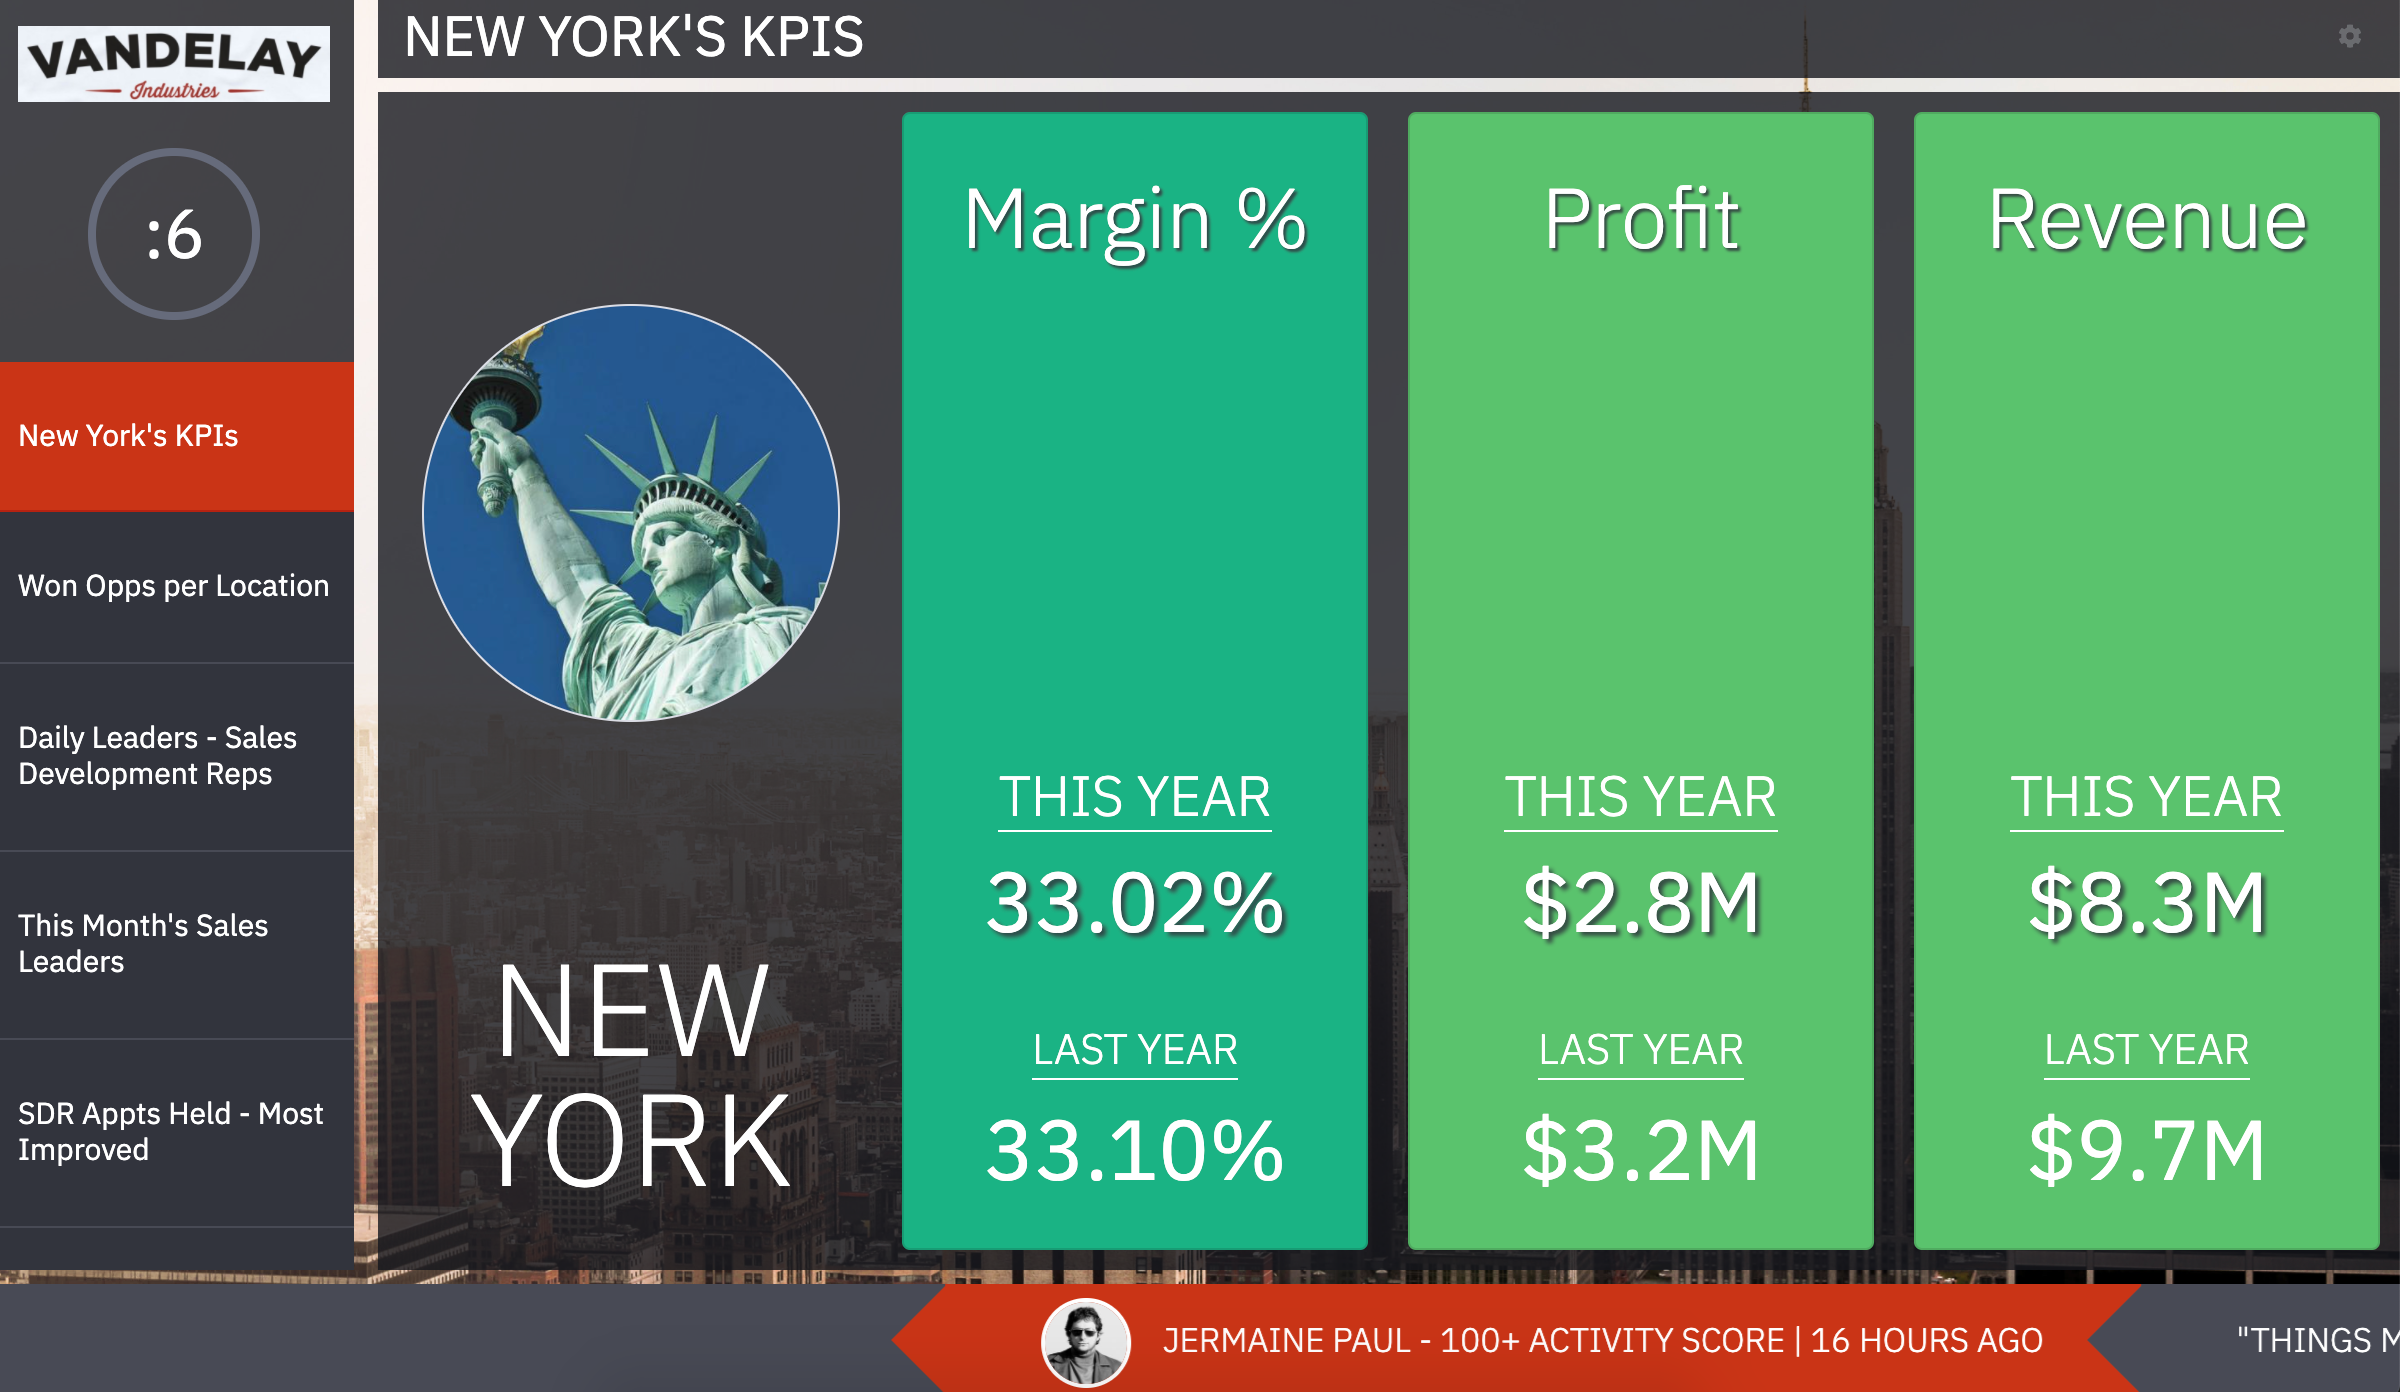
Metric Slide
Display metrics for any user, role, team, location, etc or the entire organization on the TV.
Ambition recommends pulling in key performance indicators (KPIs), company-wide metrics, and local team metrics.
Create a Metric Slide
Users with "TVs: Create" permission will be able to create, edit, and delete slides on TVs they've created.
Users with "TVs: Edit" permission will be able to create, edit, and delete slides on any TV.
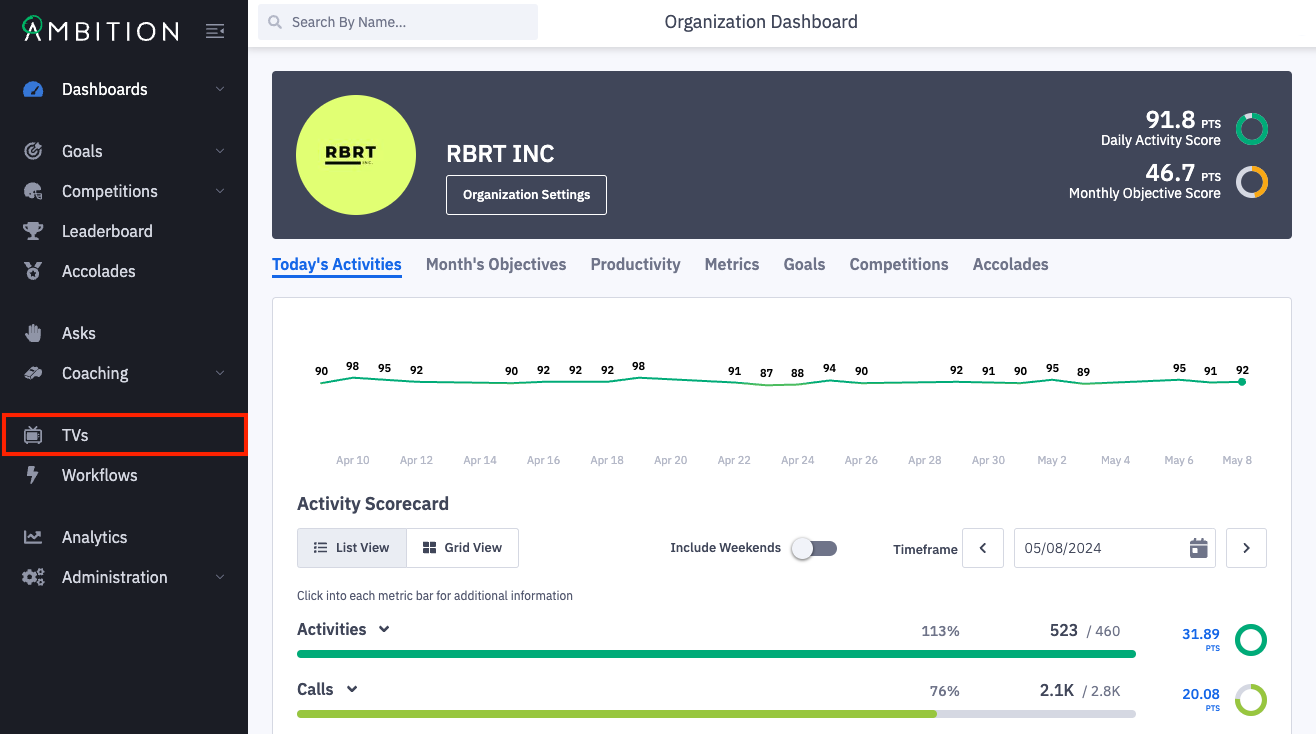
1. Open the left navigation and click TVs.
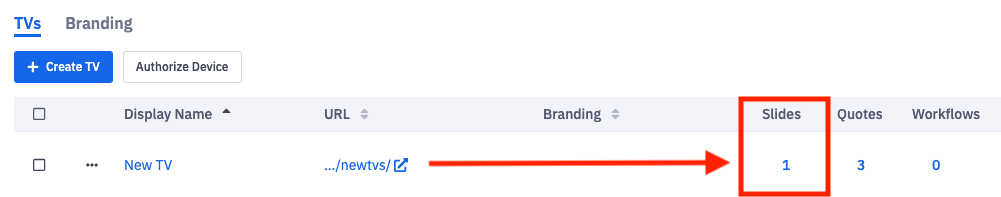
2. Click the number in the slides column on the TV you wish to edit. You can also click the ellipses icon, Edit, and Slides.
Upon clicking Slides, you will see a blank Create Slide form.
3. Complete the Create Slide Form.
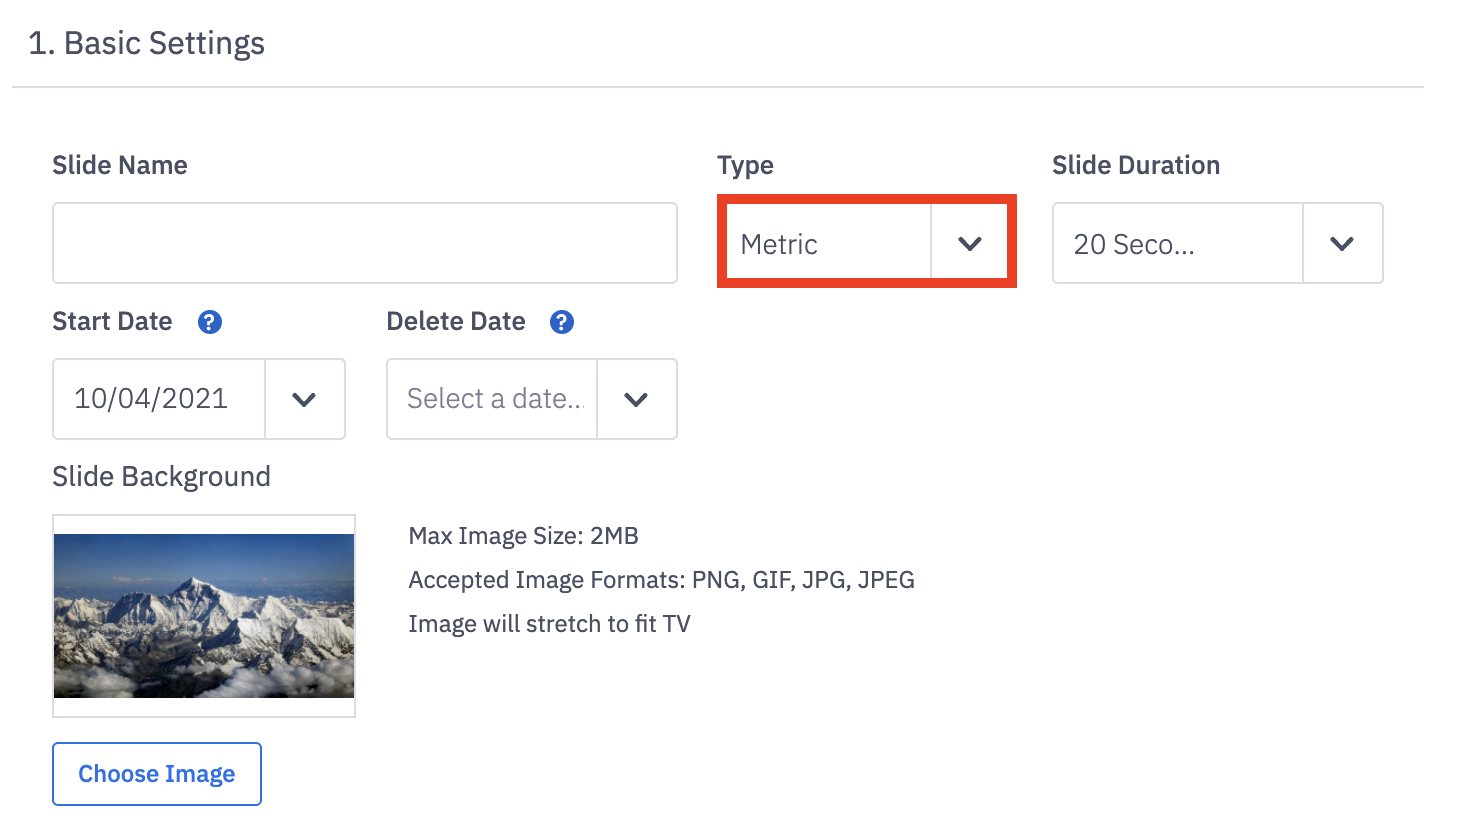
Basic Settings
Field Name | Field Description |
Slide Name | The slide name will be displayed on the TV to identify the slide. |
Type | Select Metric from the dropdown. |
Slide Duration | Determine how long this slide will be displayed per carousel rotation. Options range from 10, 20, and 40 seconds to 1, 2, 3, 4 and 5 minutes. |
Start Date | When the slide will be visible on the TV. Date defaults to today. |
Delete Date | Optional. When the slide will be removed from the TV and deleted. |
Slide Background | Optional. Upload a background image for the slide. |
Select Entity
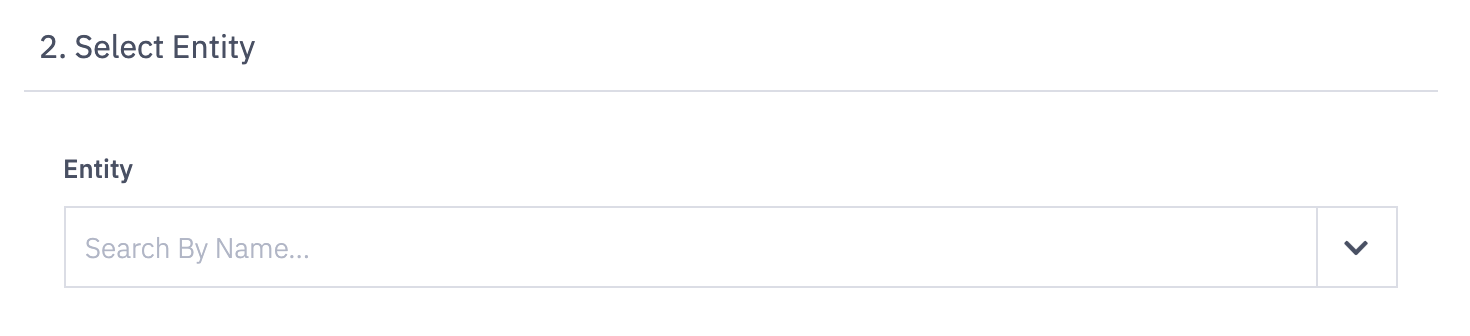
Select the hierarchy level, ex. Employees, role, team, that you'd like to display data for on the metric slide.
Special Note about the "Manager" Hierarchy Level In Cases where a Manager Manages other Managers.
If Manager A is listed as a Manager B's manager within their User Settings, any of Manager B's direct reports will also be considered as users Manager A manages, or Manager A's subordinates.
Select Metrics (up to 3 per slide)
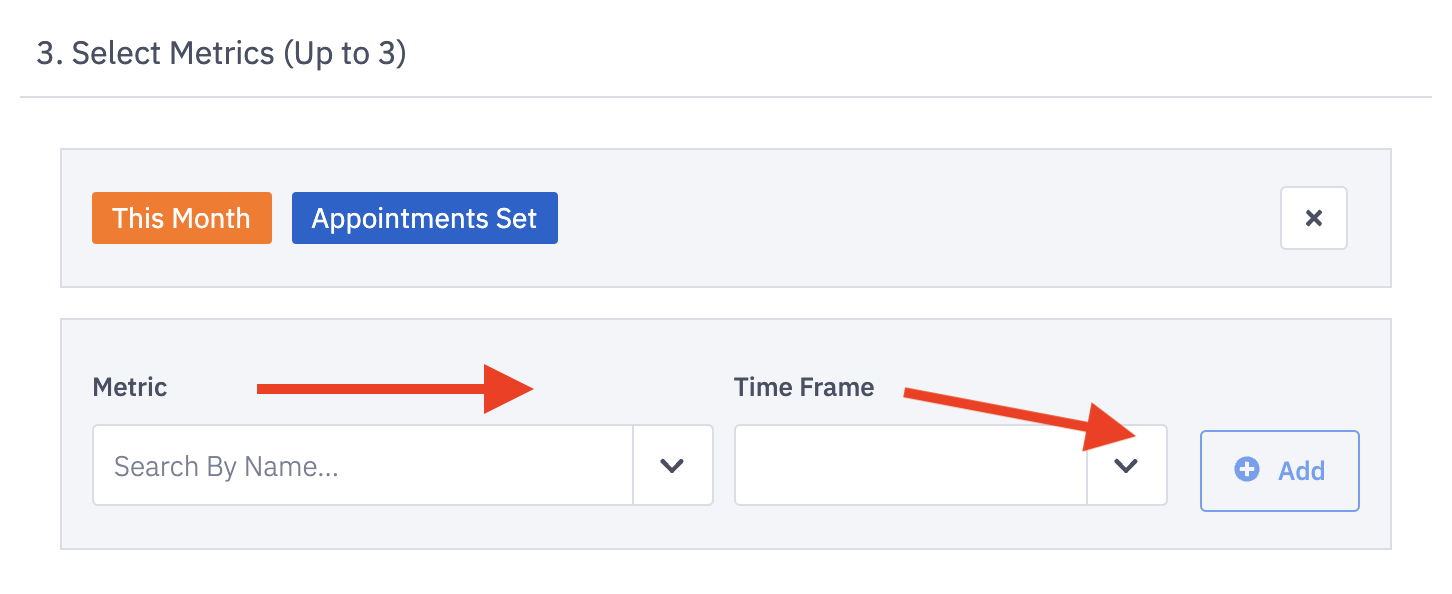
Select 1-3 Metrics and their individual time frames that you'd like to display for the selected entity (above).
Metric - Select any Metric found in your Ambition account.
Best Practice is to pull in Metrics from Scorecards.
Time Frame - Select a time frame to compare the selected User's performance against.
Example: 'This Month' will compare the current month's performance to last month's total.
After selecting each Metric and Time Frame, click the Add button.
To remove a Metric, click the x in line with the Metric you wish to remove.
4. Optionally click the Preview button to preview your metric slide.
Note: Uploaded slide background images will not be viewable through the Preview option.
5. Click the Save button.

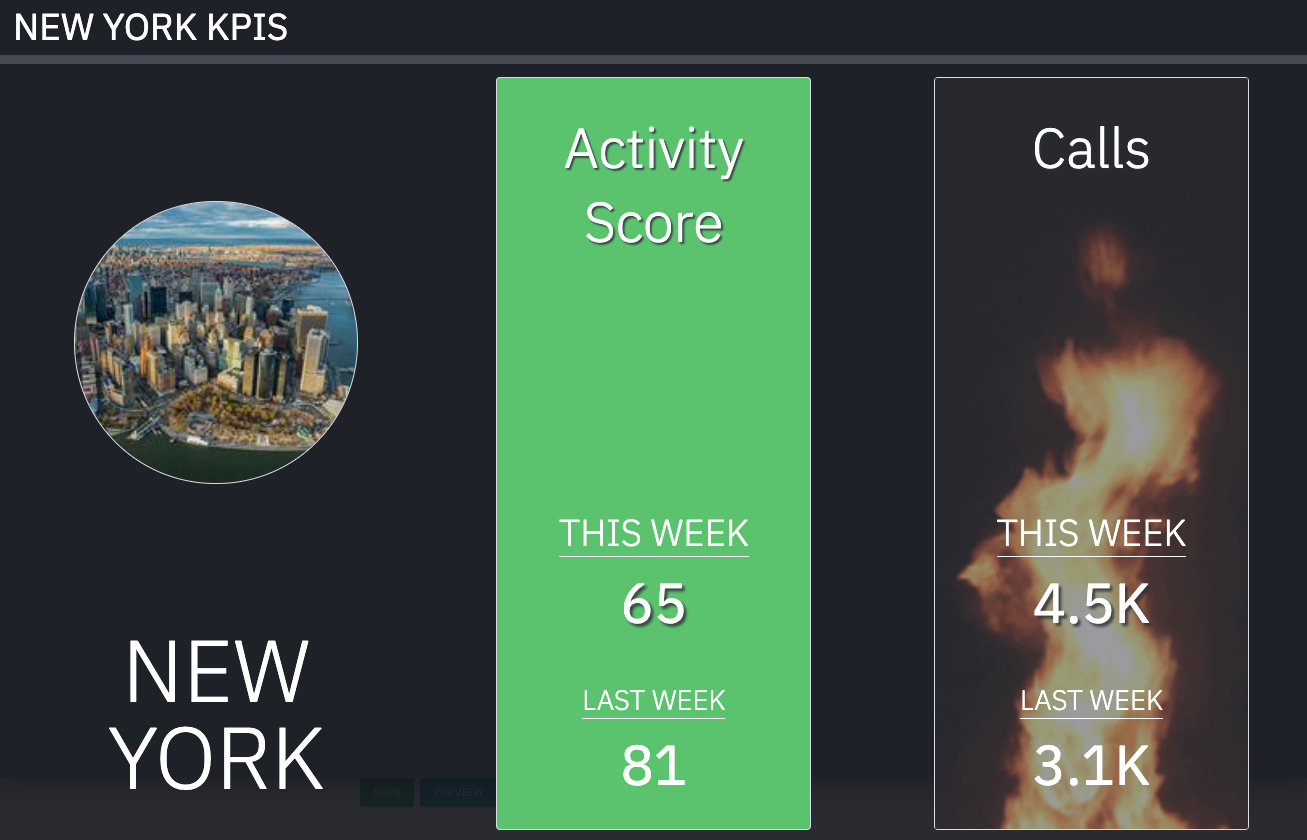
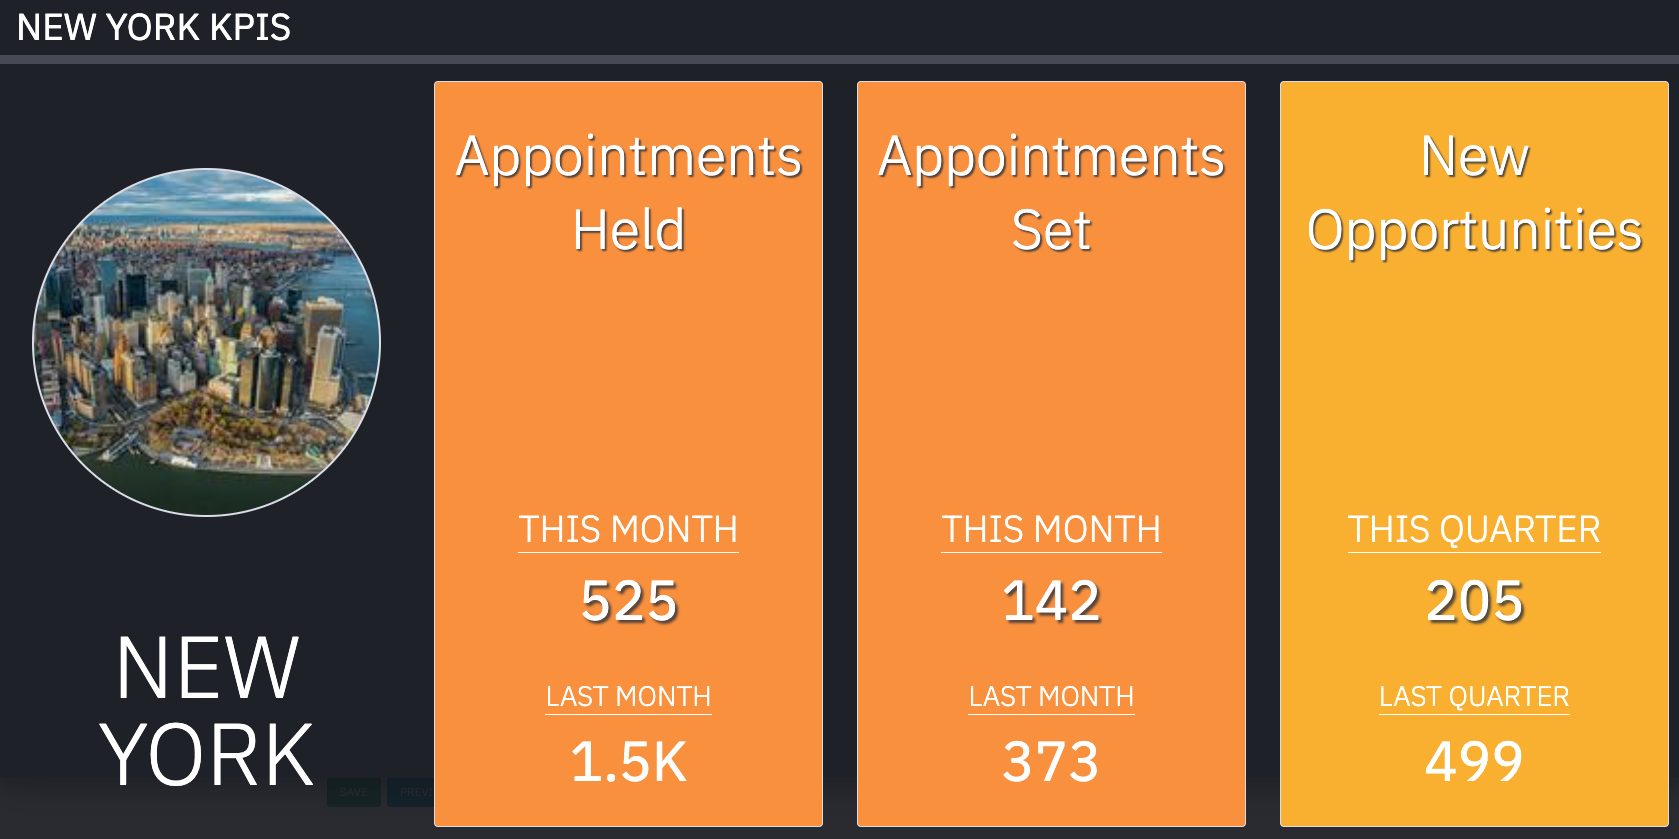
Display Colors and Flames
Once the metric slide is live, you'll notice a few colors, and if you're lucky, some flames!
Colors: The metrics are color-coded based on the current value compared to the previous value.
Red - Not on track to meet the previous time frame's total.
Yellow - Falling short of the previous time frame's total.
Green - Very close or at par with the previous time frame's total.
Flames: If the selected employees or group exceeds their previous value for the metric in question, flames will appear.