How do I create a Leaderboard TV Slide?
Last updated: October 17, 2025
Leaderboard TV Slide
Scorecards must be configured in order to use the "percent-to-target" leaderboard slide option.
The leaderboard slide will display top (and optionally, bottom) performers for given metrics, time frames, and groupings.
Leaderboard TV slides can be viewed either as a card or a grid.
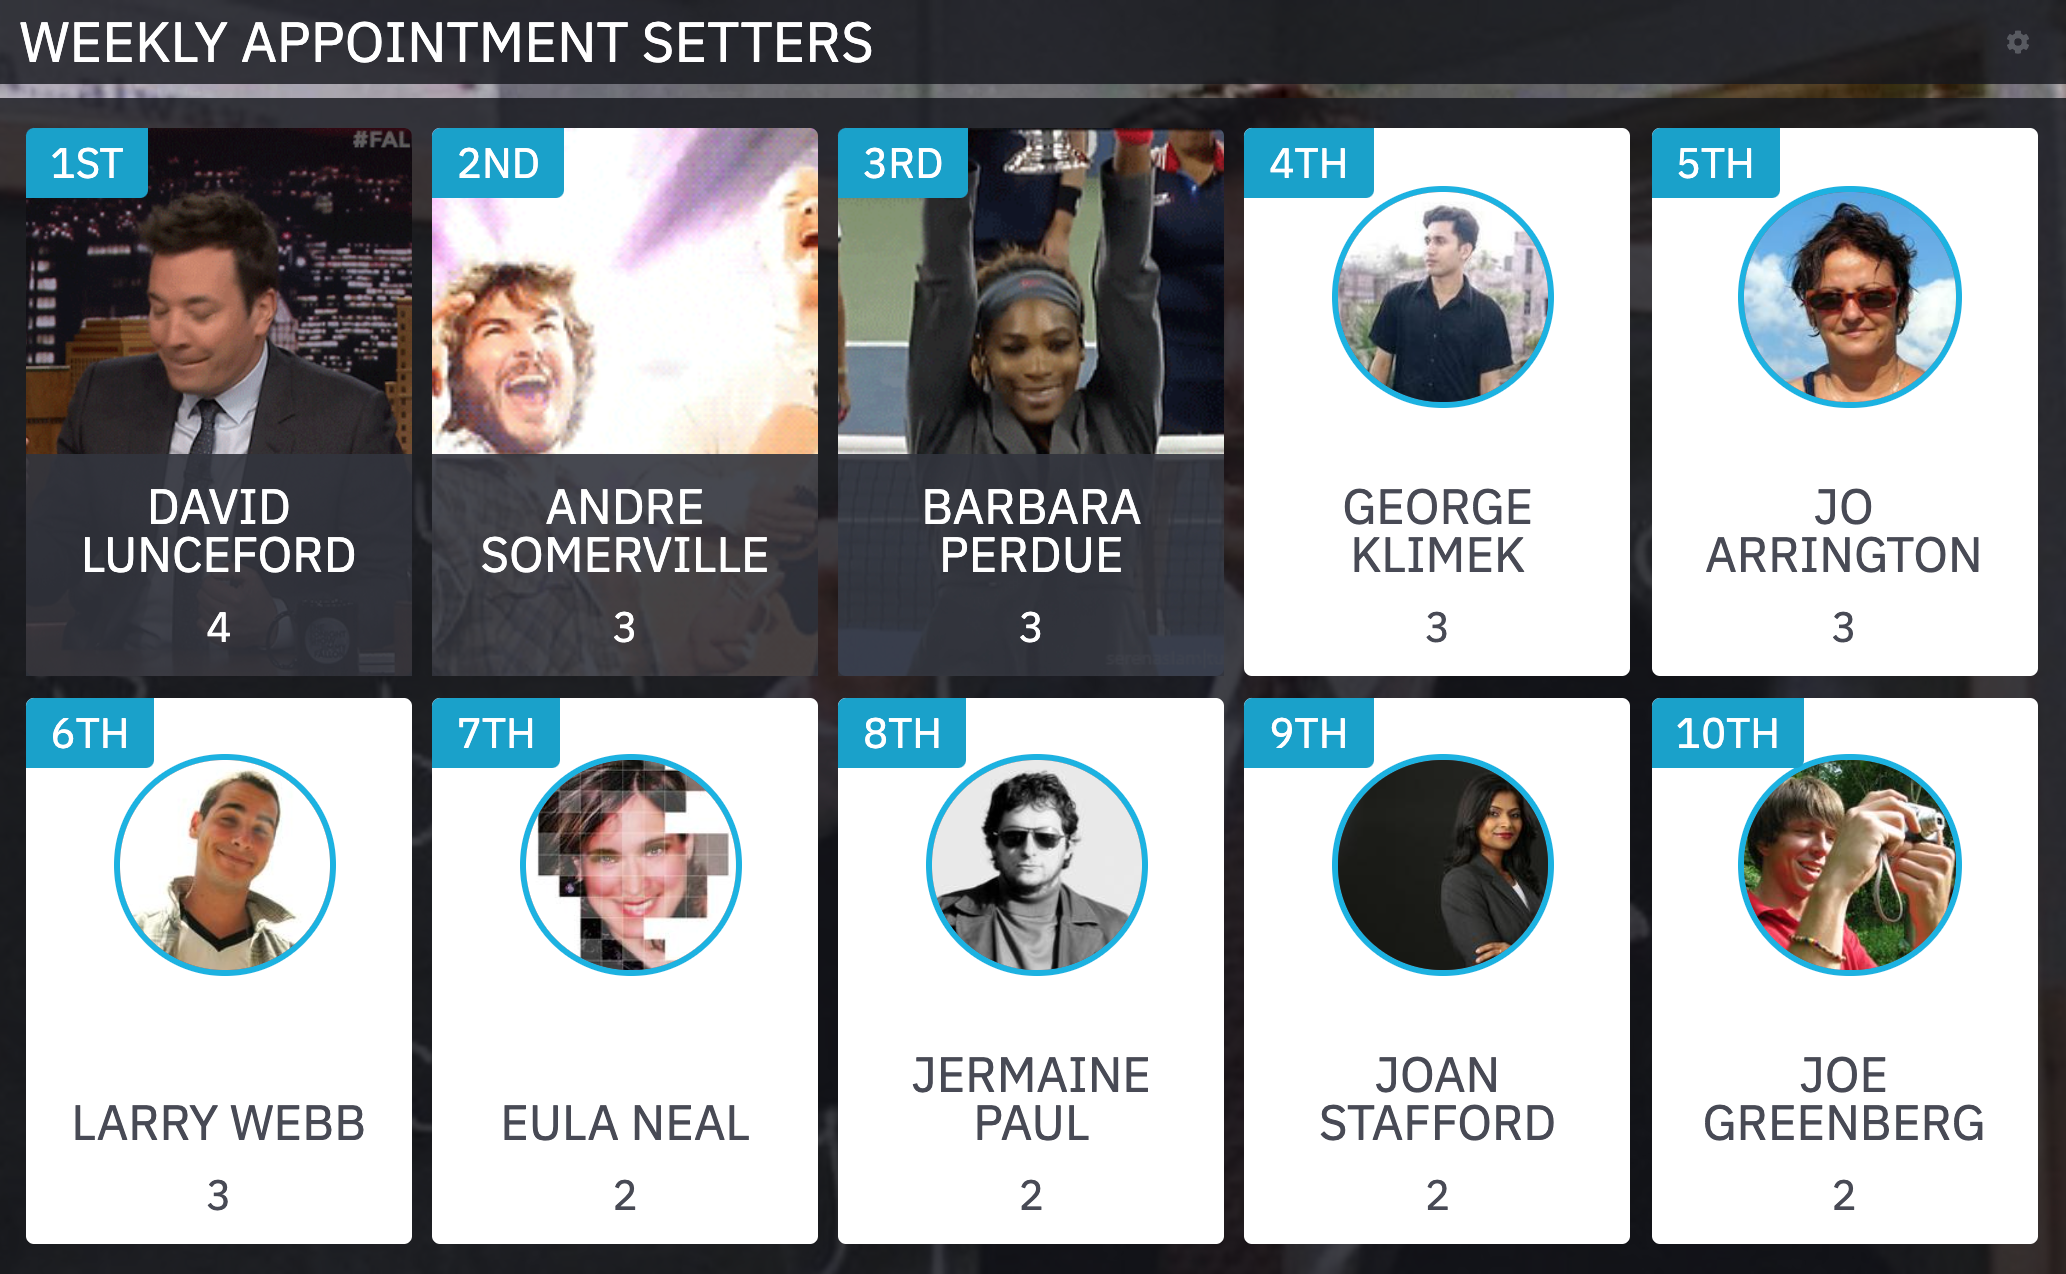
With the card-style view, one "card" displays each user or group's name, image, and score. A user or group's GIF will be shown instead of their image if they are in the first, second, or third positions. If they have not selected a GIF, then their profile image will be shown.
When the grid-style layout is selected, users are listed vertically in descending or ascending order.
 Card view supports 1 metric | 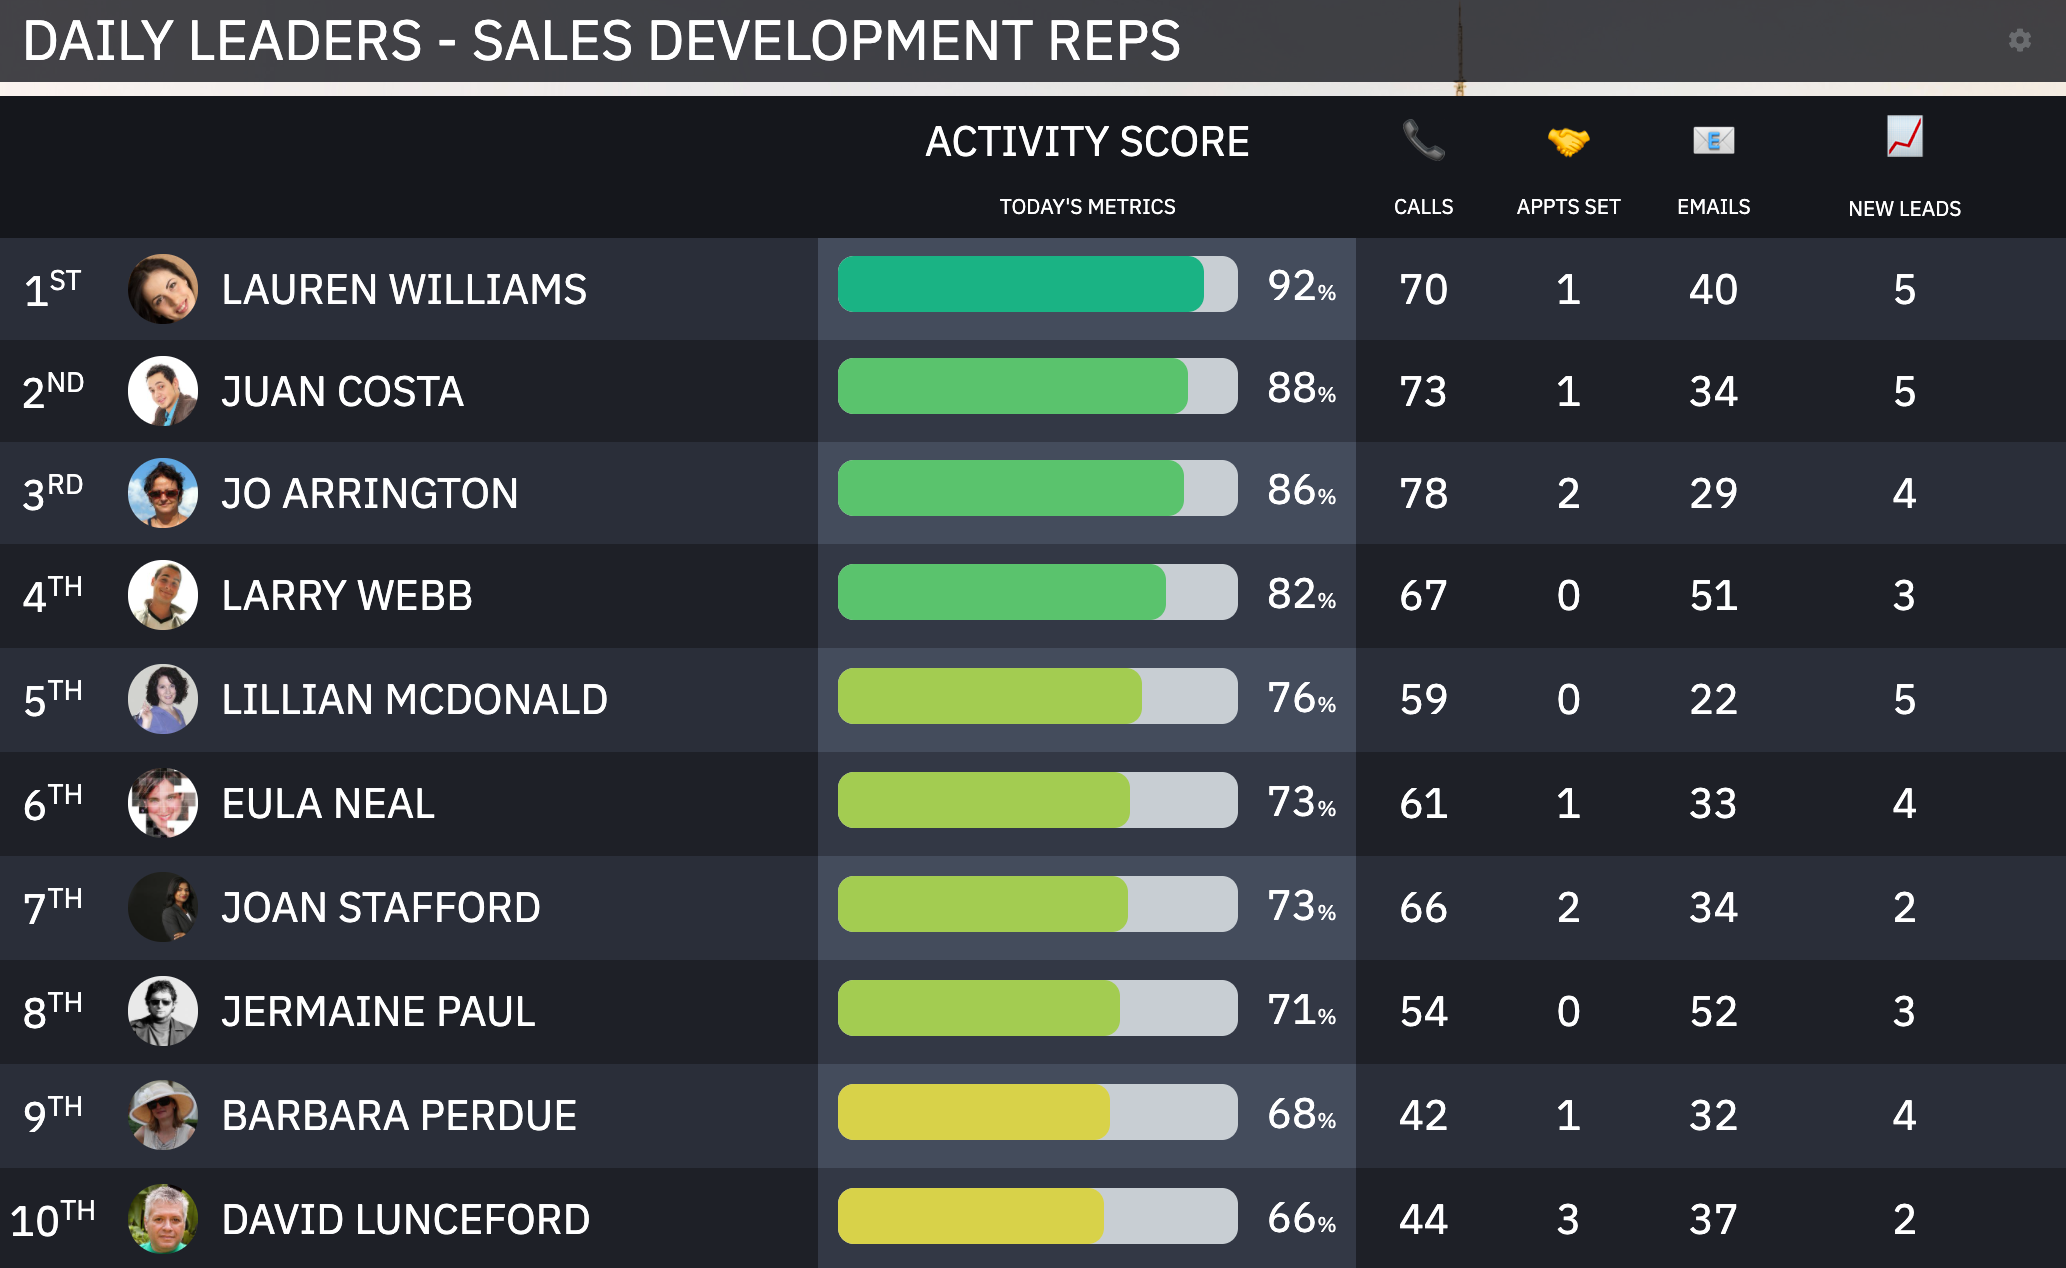 Grid view supports 1-5 metrics |
The card-style view is limited to displaying one metric at a time, whereas the grid-style view can display up to five metrics at a time.
Create a Leaderboard Slide
Users with "TVs: Create" permission will be able to create, edit, and delete slides on TVs they've created.
Users with "TVs: Edit" permission will be able to create, edit, and delete slides on any TV.
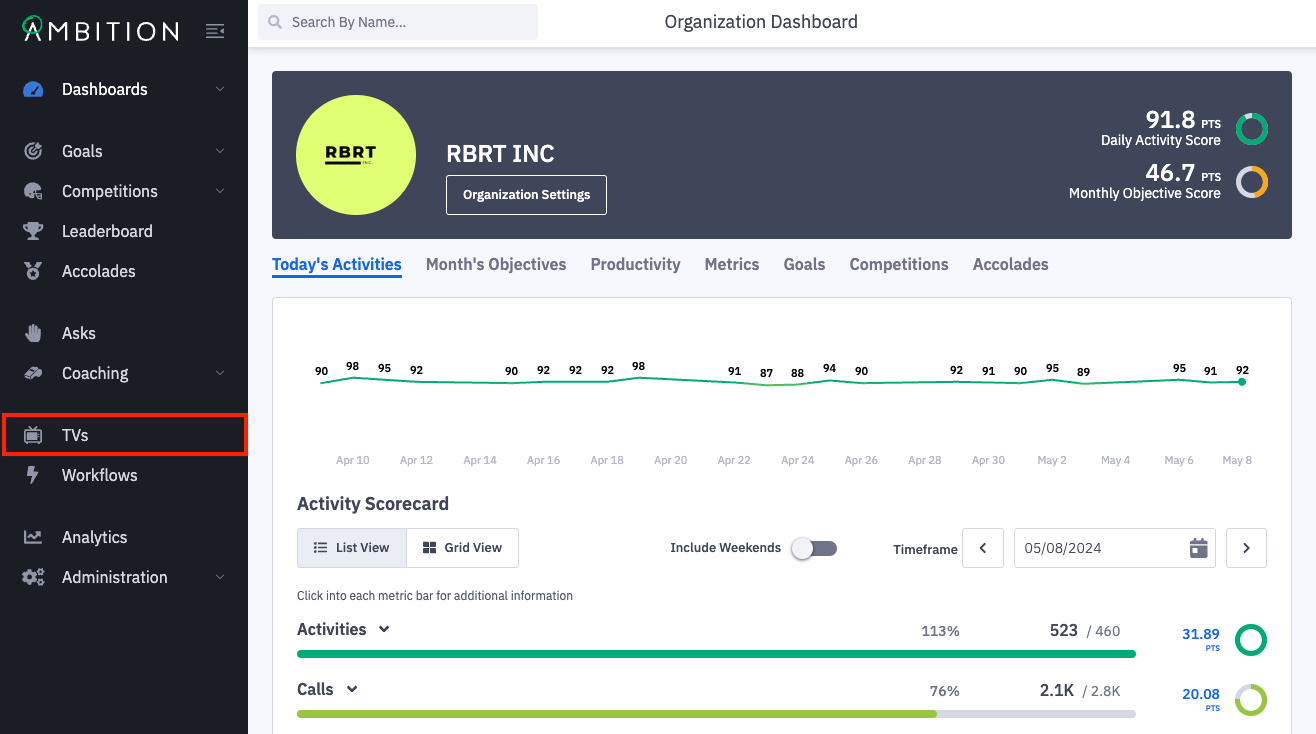
1. Open the left navigation and click TVs.
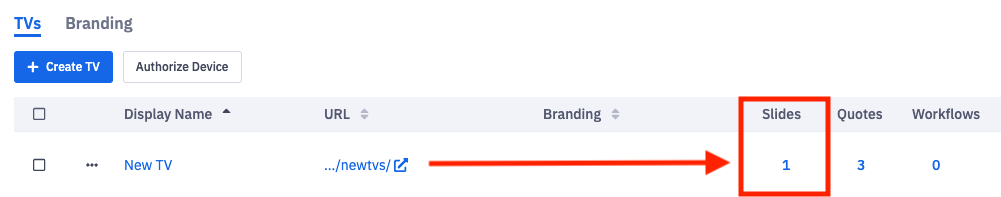
2. Click the number in the slides column on the TV you wish to edit. You can also click the ellipses icon, Edit, and Slides.
Upon clicking Slides, you will see a blank Create Slide form.
3. Complete the Create Slide form.
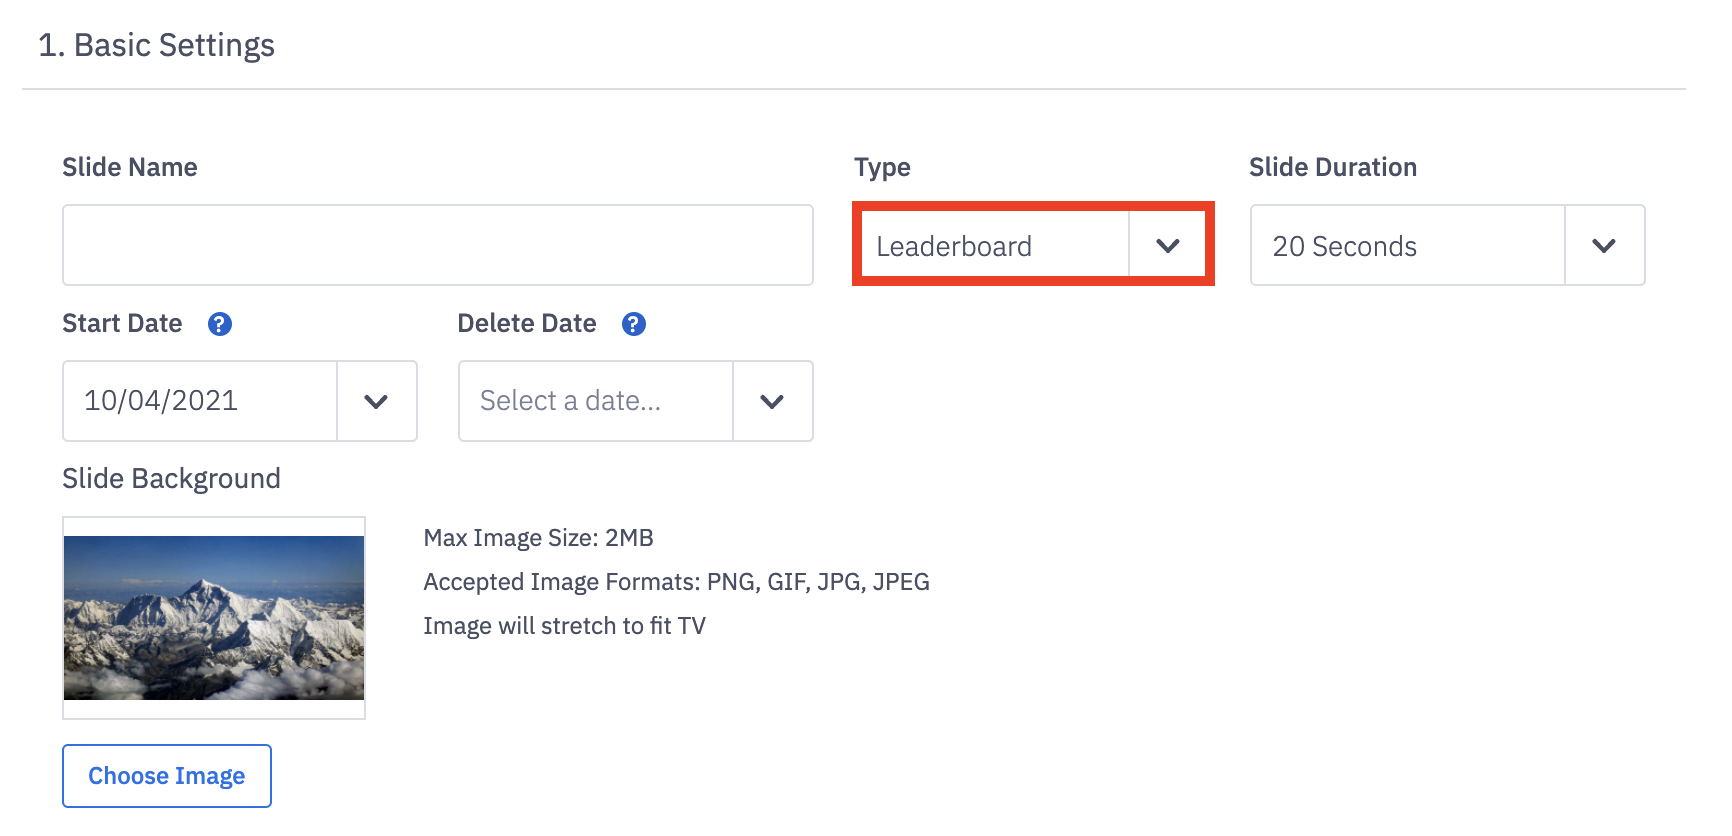
Basic Settings
Field Name | Field Description |
Slide Name | The slide name will be displayed on the TV to identify the slide. We recommend being explicit in naming the slide. Example, if you're using a Most Improved by Rank slide, add this to the slide's title! |
Type | Select Leaderboard from the dropdown. |
Slide Duration | Determine how long this slide will be displayed per carousel rotation. Options range from 10, 20, and 40 seconds to 1, 2, 3, 4 and 5 minutes. |
Start Date | When the slide will be visible on the TV. Date defaults to today. |
Delete Date | Optional. When the slide will be removed from the TV and deleted. |
Slide Background | Optional. Upload a background image for the slide. |
Select Metrics (Up to 5)
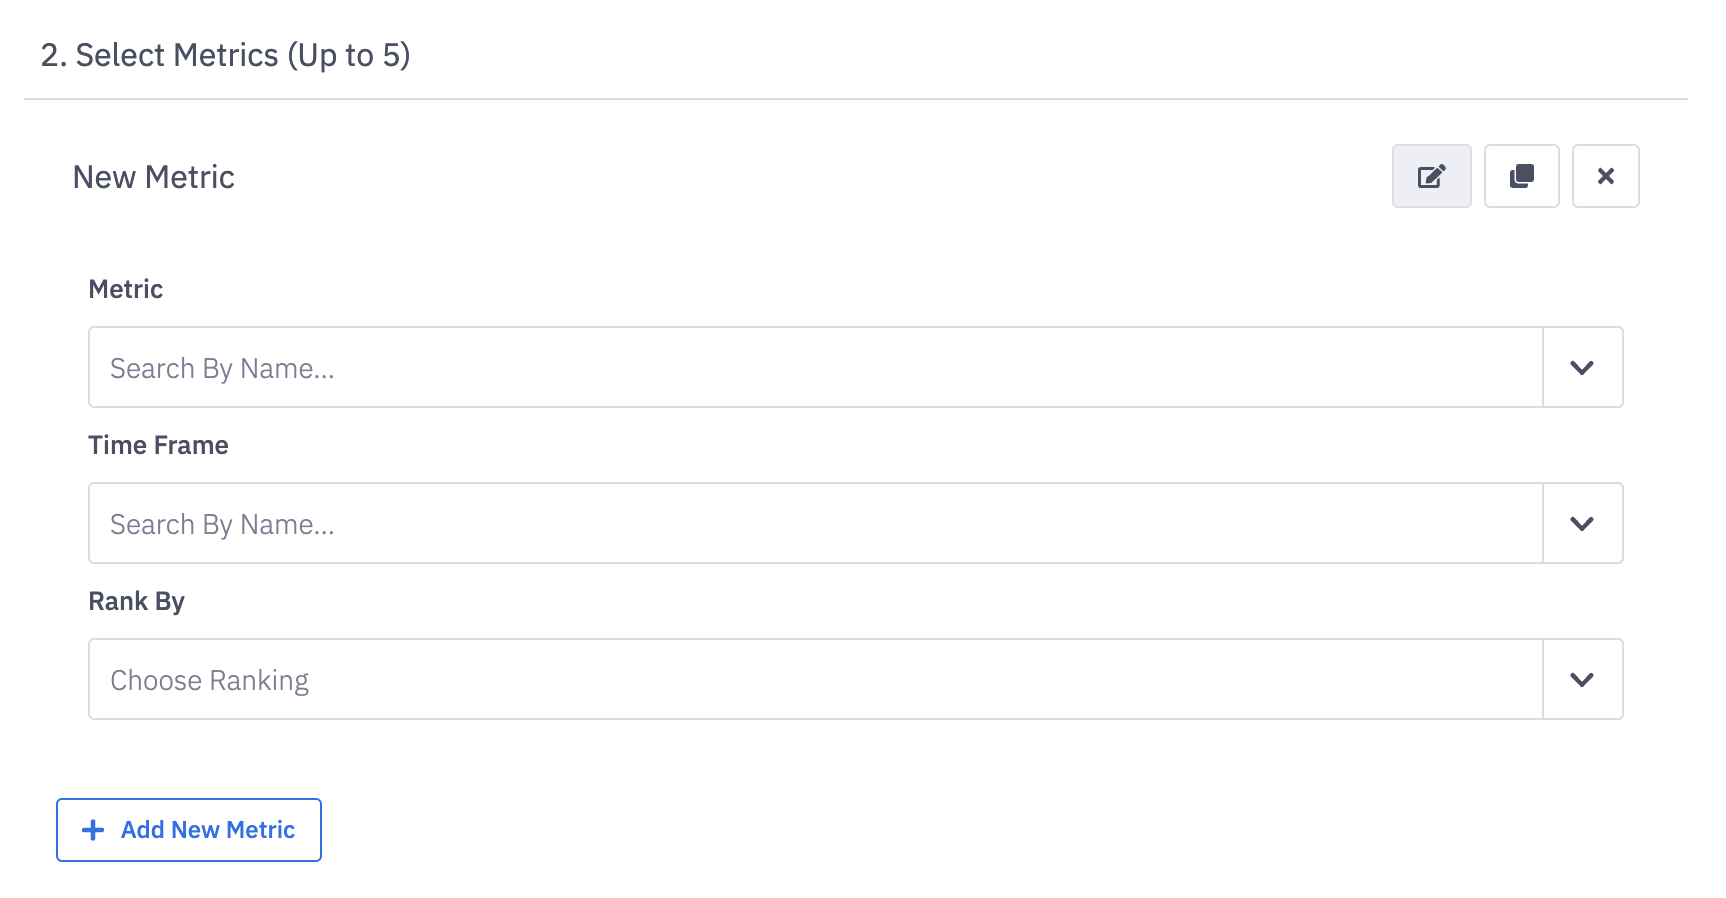
Metric: Select the metric to be displayed.
Time Frame: Time Frame of data to be displayed. Includes preset time frames and custom options
Preset options - Today, Yesterday, This and Last Week, This and Last Month, This and Last Quarter, This and Last Year.
↳ Select a preset time frame option if creating a Percent-to-Target or Most Improved Leaderboard. Using custom time frames is only supported for Value Leaderboards.
Custom - select specific start & end dates to match a fiscal calendar. At the current time, the custom time frame option can display data for a time range of up to 3 years. ex. January 1st, 2020- January 1st, 2023.
Note about Formula Builder Metrics: If you are viewing formula builder metrics that have been combined with other formula builder metrics, view data for the combination metrics on day, week, month, quarter, or year time frames rather than custom.
Rank By:
Value
Percent to Activity or Objective Scorecard Target
If a Percent-to-Target Leaderboard is selected, data for Users without a Scorecard Target will not show UNLESS "Include Users Without Date is selected" in step 4.
Examples of all leaderboard types below.
Select the desired Metric, Time Frame, and Rank By option.
Click the Add New Metric button to add additional metrics.
If more than one metric is selected:
the slide will automatically be converted from card view to grid view
the first metric will determine ranking for the slide
if you wish for the first metric to always determine ranking, enable the Include Records (users/groups) Without Data option found at the bottom of the slide if you wish to always show all eligible users and groups even if they don't have data for the first metric.
if the first metric does not have data then the second metric will be used to rank the slide, and so on. If if no eligible users or groups have data for any of the metrics and the Include Records Without Data option is not enabled, a no data message will display for the entire slide
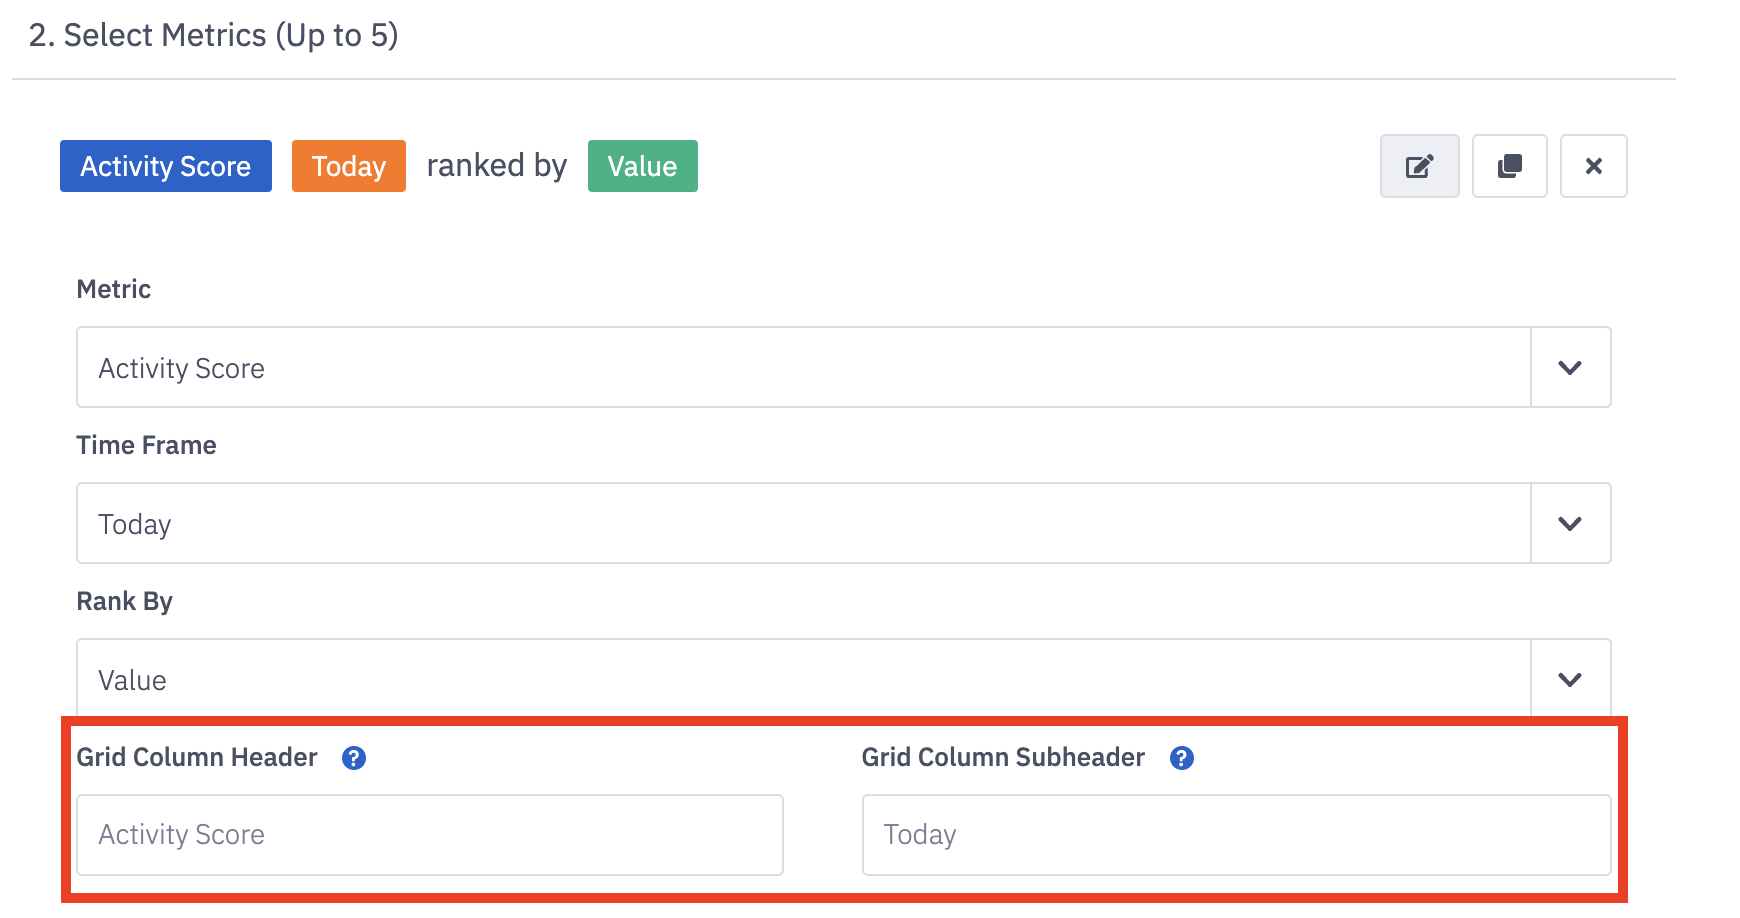
grid column and sub-header customization options will display
Edit the Column's Header or Sub-Header
When using a Grid View Leaderboard, you can customize the column header and subheadings that display on the respective slide.
If the metric's time frame is later updated, the grid column sub-header does not automatically update in effort to not overwrite any custom sub headers. If you are seeing a mismatch with the time frame selected and the data being shown on the TV slide, ex. time frame is set to "This Month", but slide sub header displays "This Week", check the grid column sub header.
Great use cases include:
Shorten metric names that are too long (ex: change 'Won Opportunities' to 'Won Opps')
If all metrics have the same time frame, remove the sub-header so that you don't have repetitive time frames visible on the slide - example: all 5 metrics say 'This Week'. Be sure to add 'This Week' to the slide's title for clarity.
Add emojis. Instead of showing 'Calls' as the metric header, show '☎'!
Mac Keyboard Shortcut =
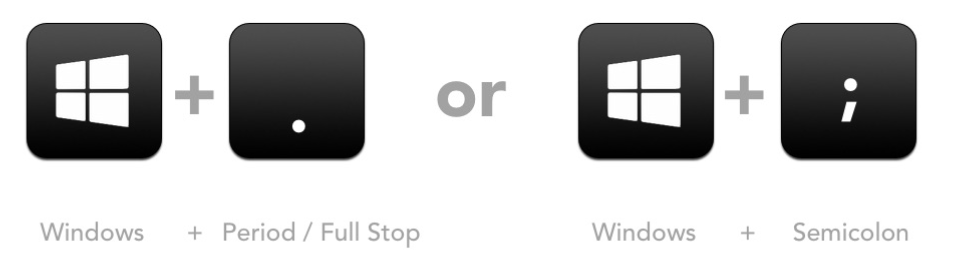
Control+Command+Space BarWindows 10 Keyboard Shortcut =
Window+Period
Examples of a Value Leaderboard
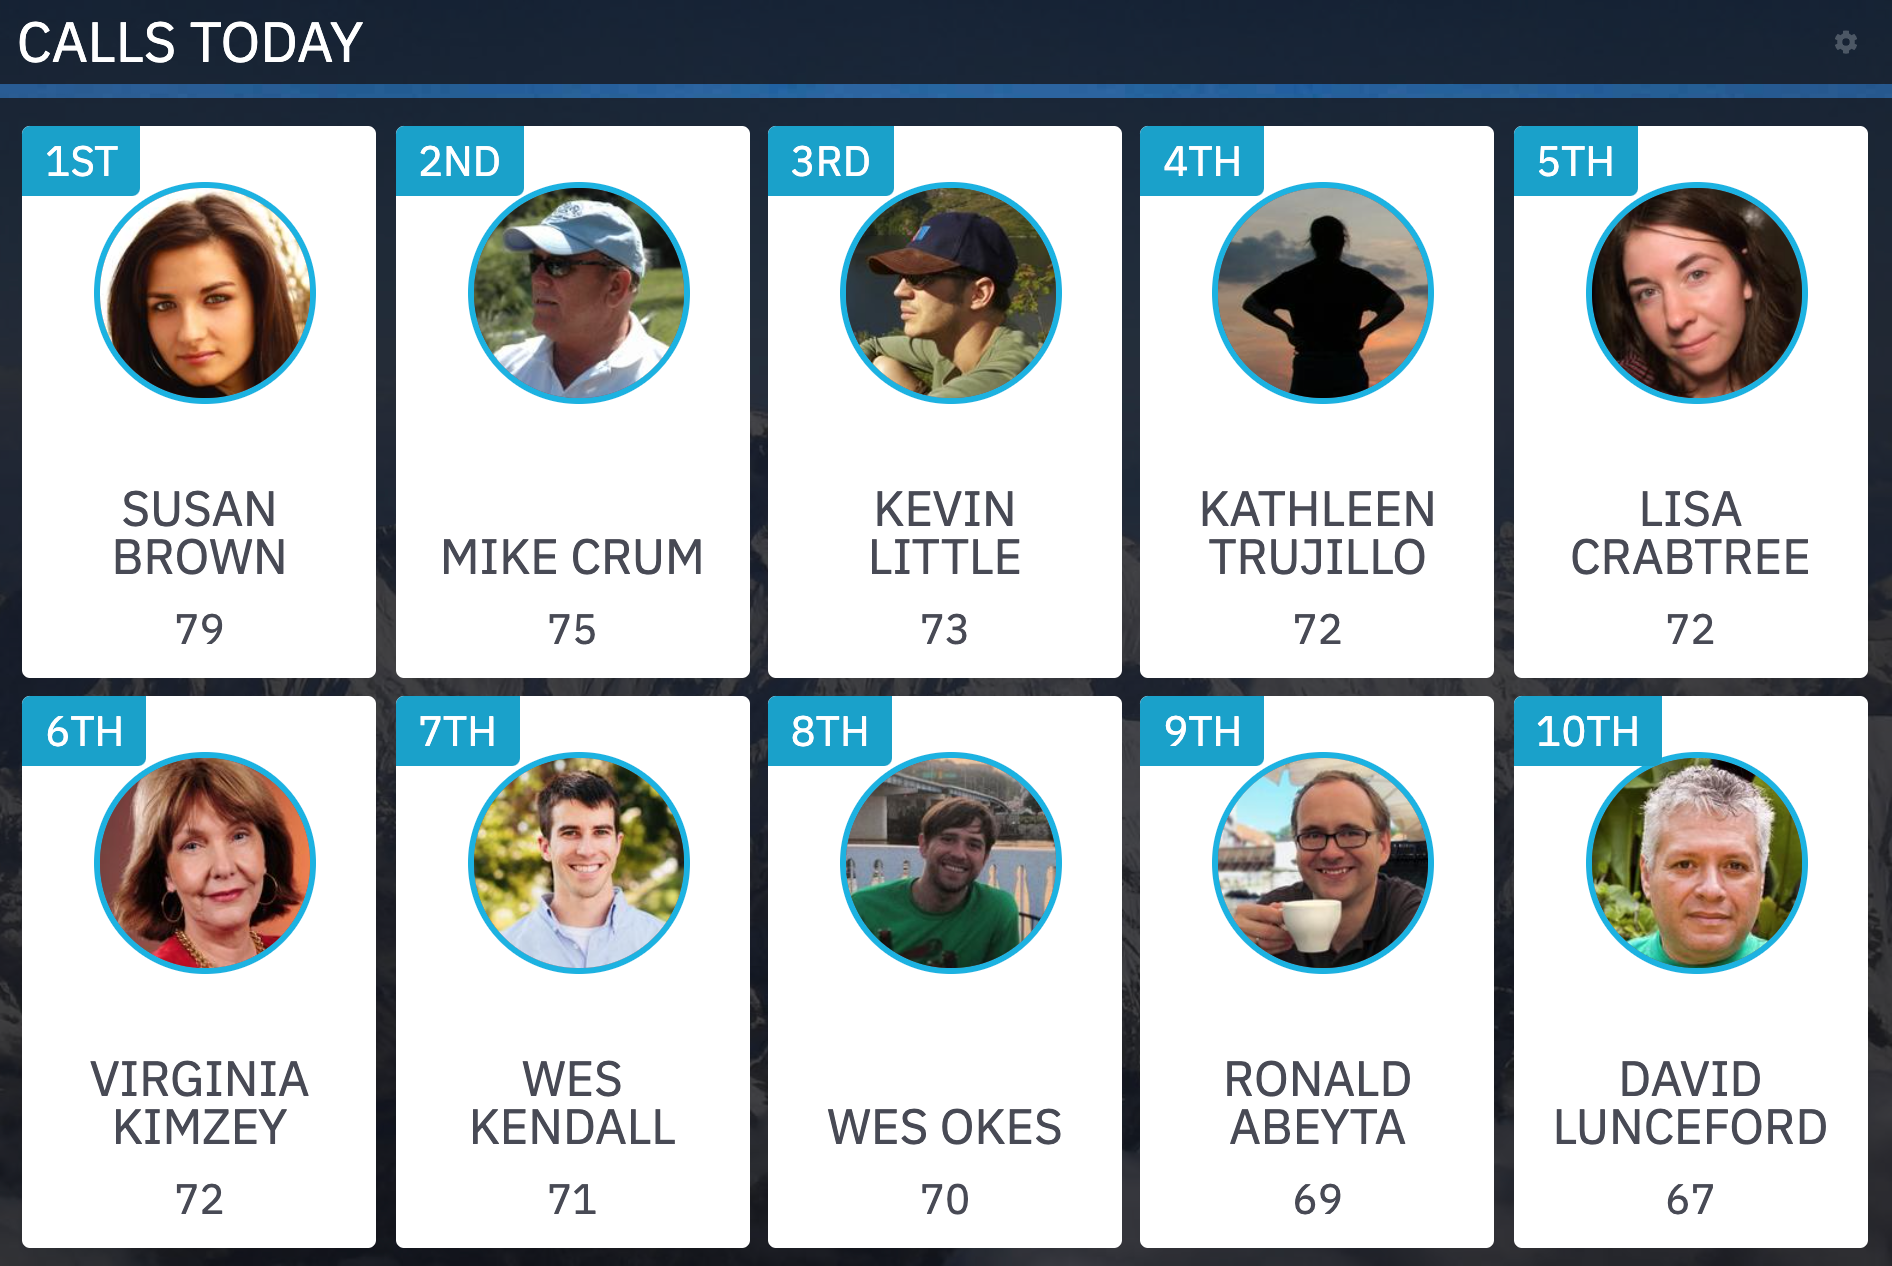 Card View | 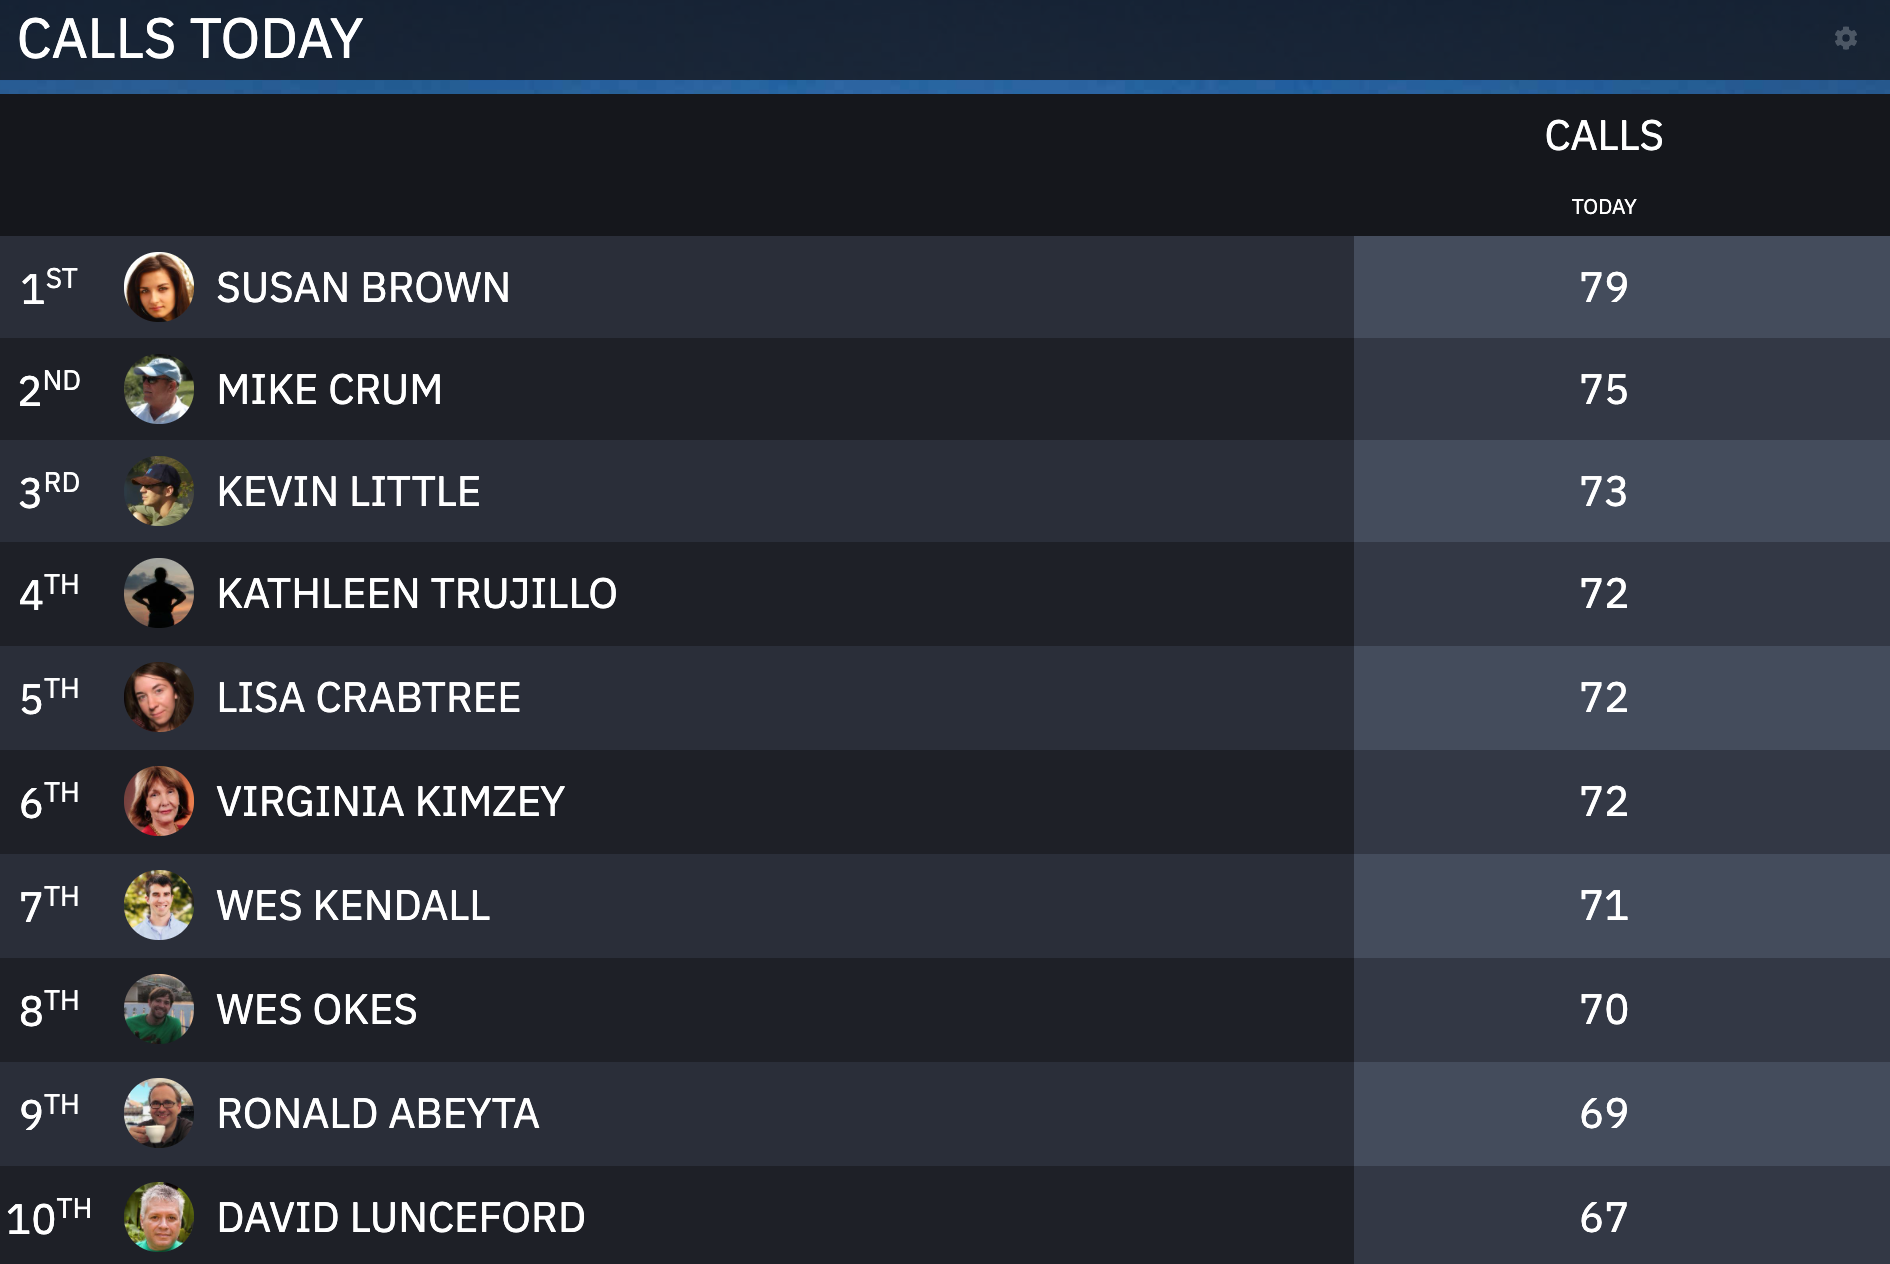 Grid View |
Examples of a Percent to Activity Target Leaderboard
When using the percent-to-target option, two criteria must be met:
1. The metric must be on an employee's scorecard
2. the percent-to-target time frame must match the scorecard time frame.
Otherwise, the percent-to-target values will not populate.
For example, the "Calls" metric in the screenshot below is on the SDRs' Activity scorecard, which is tracked daily.
Percent-to-target values will be shown if the leaderboard has "Today" set as the time frame. Values will be blank if any other time frame is chosen.
Click here to learn more about percent-to-target leaderboards.
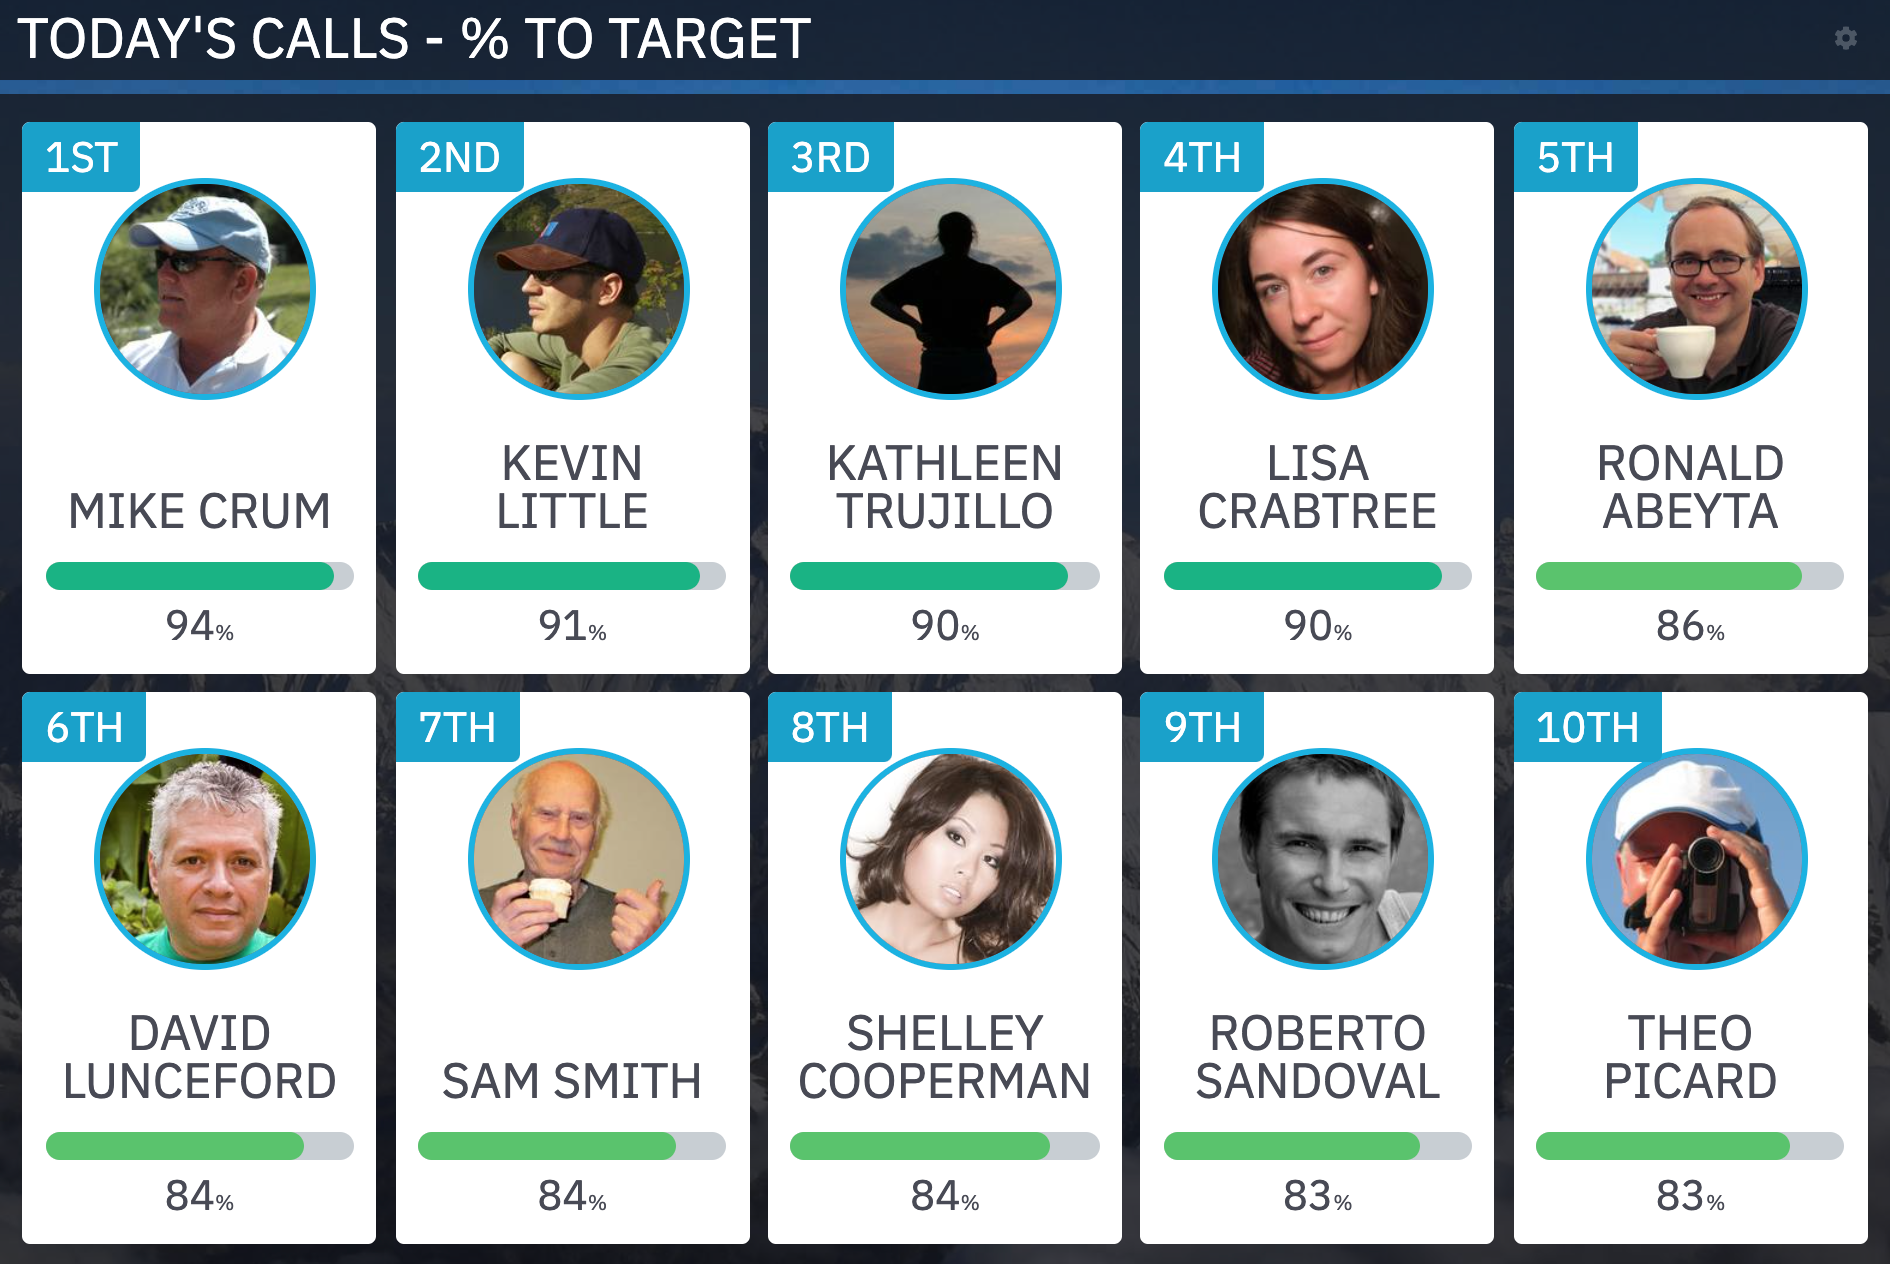 Card View | 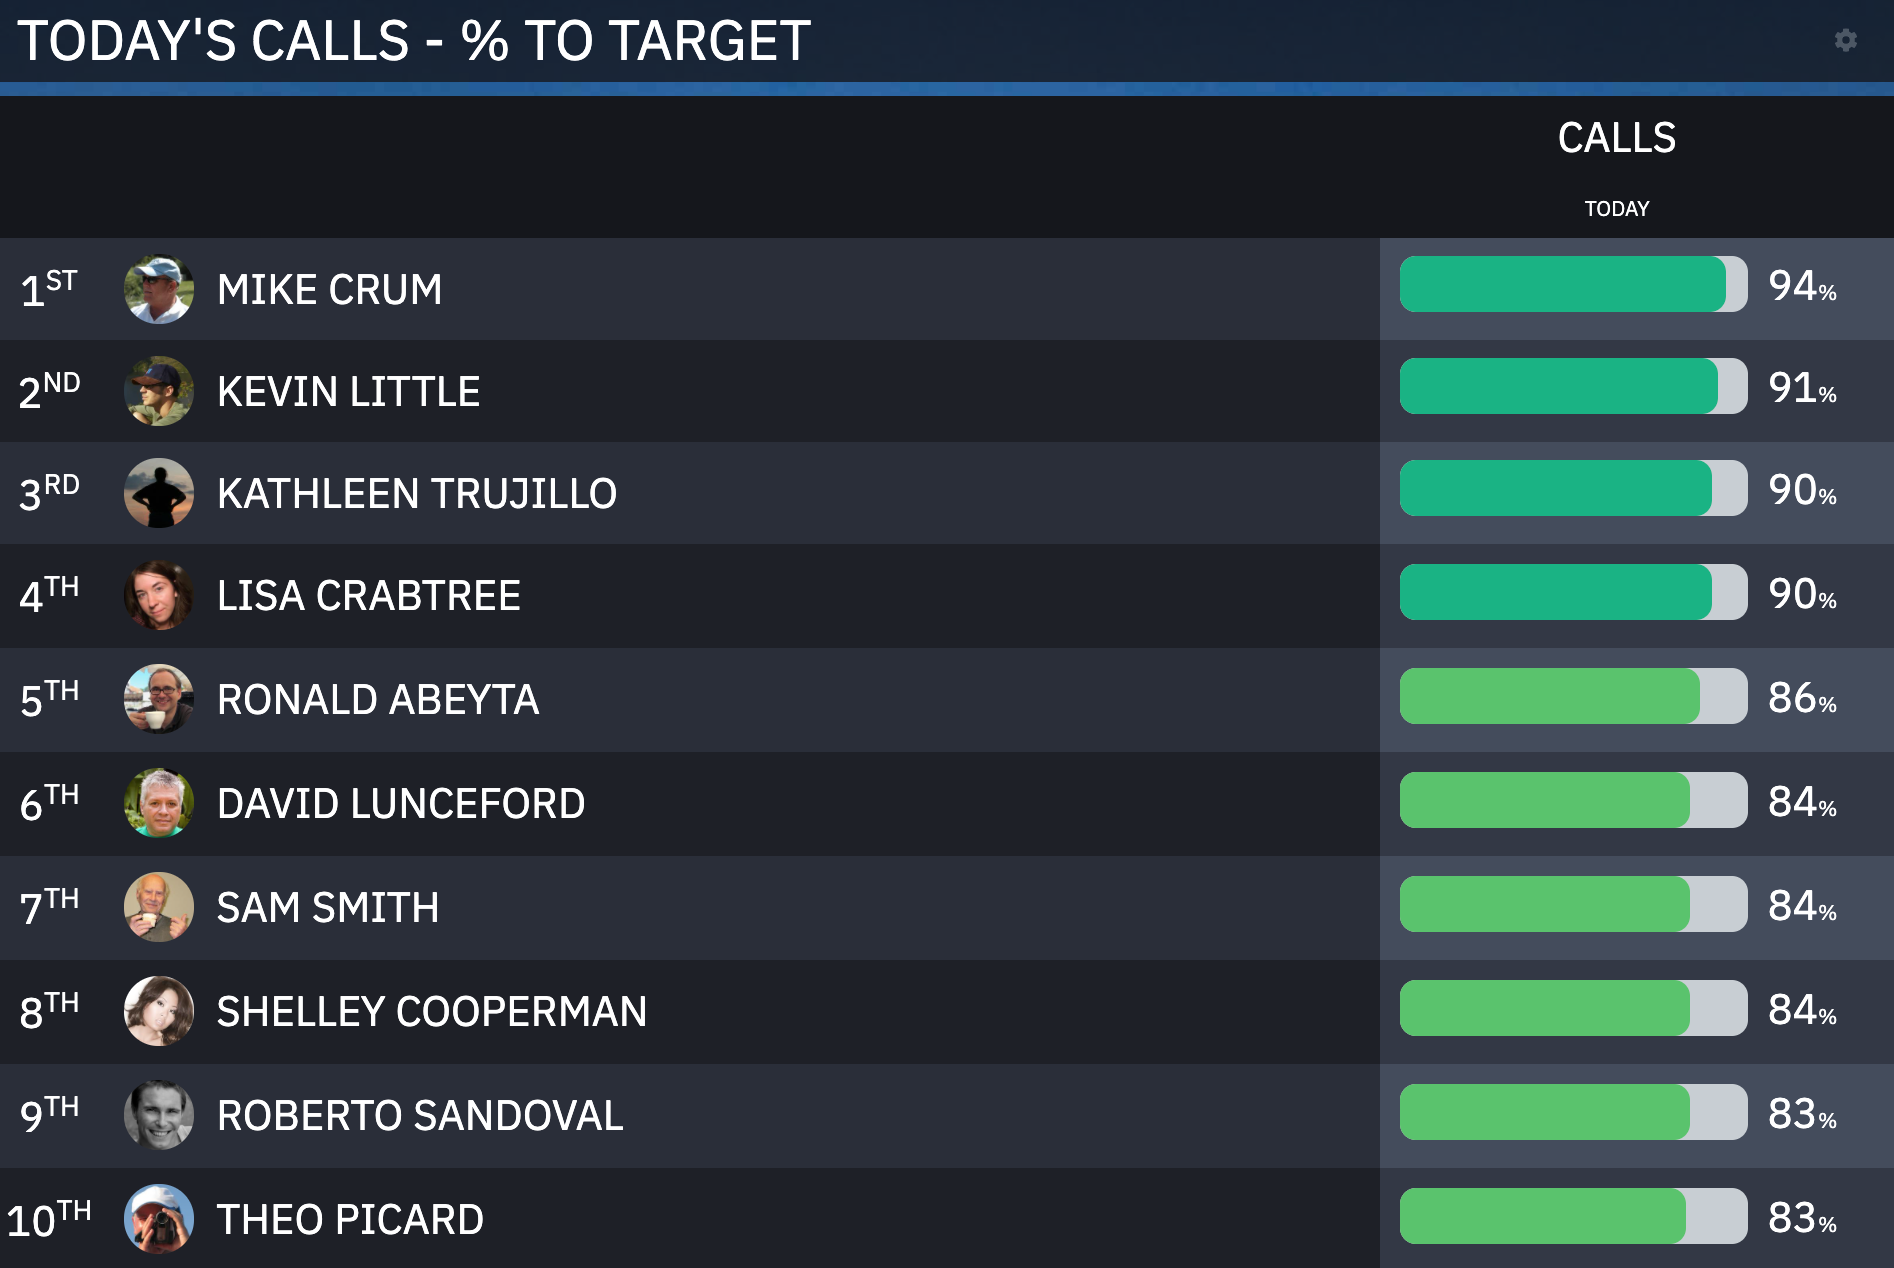 Grid View |
Examples of Most Improved by Value Leaderboard
The value improved is listed in green while the the actual metric value is listed in black text.
Ex. Donna Humphries set 21 meetings last month. That is 8 more than the previous month.
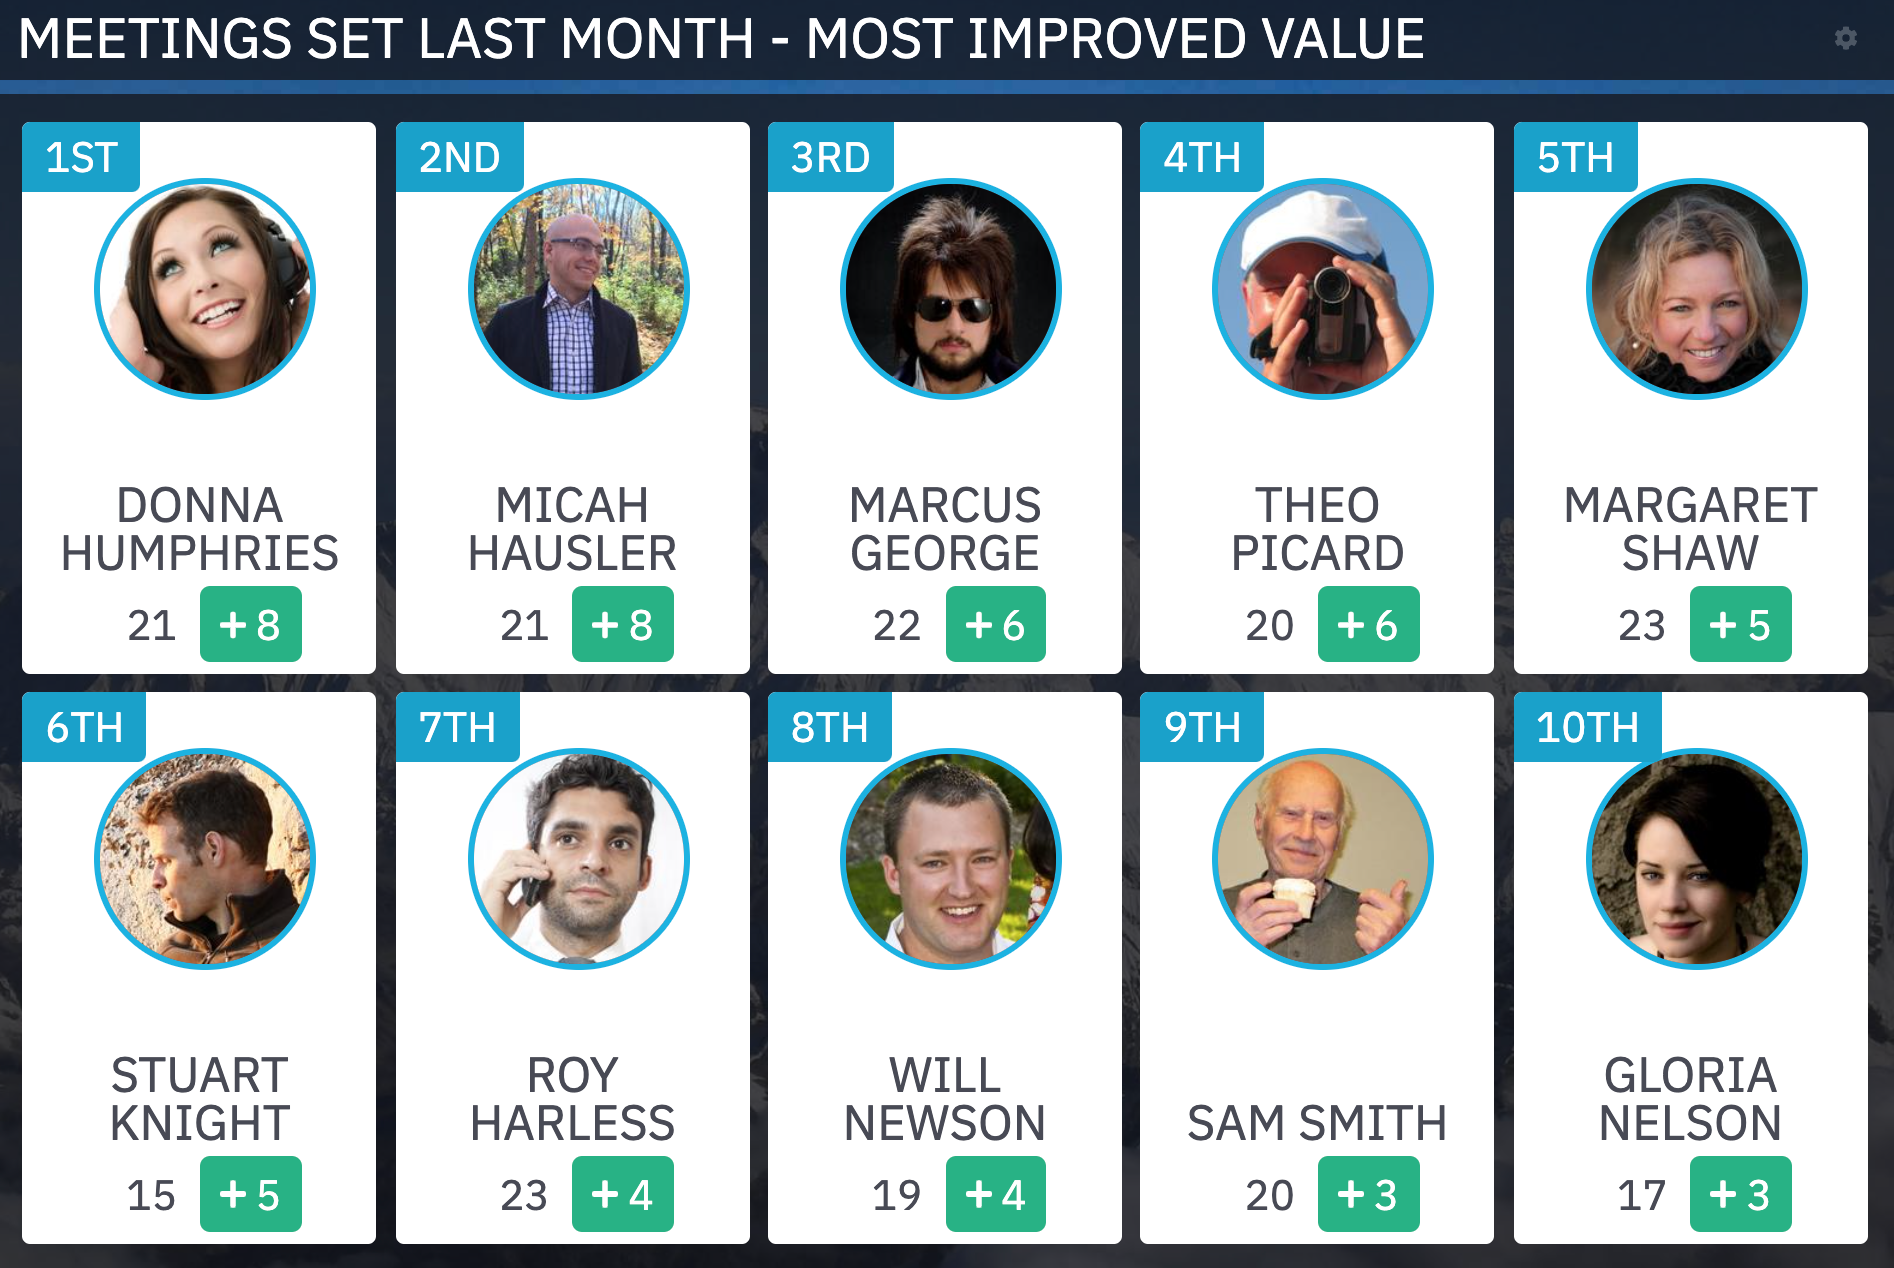 Card View | 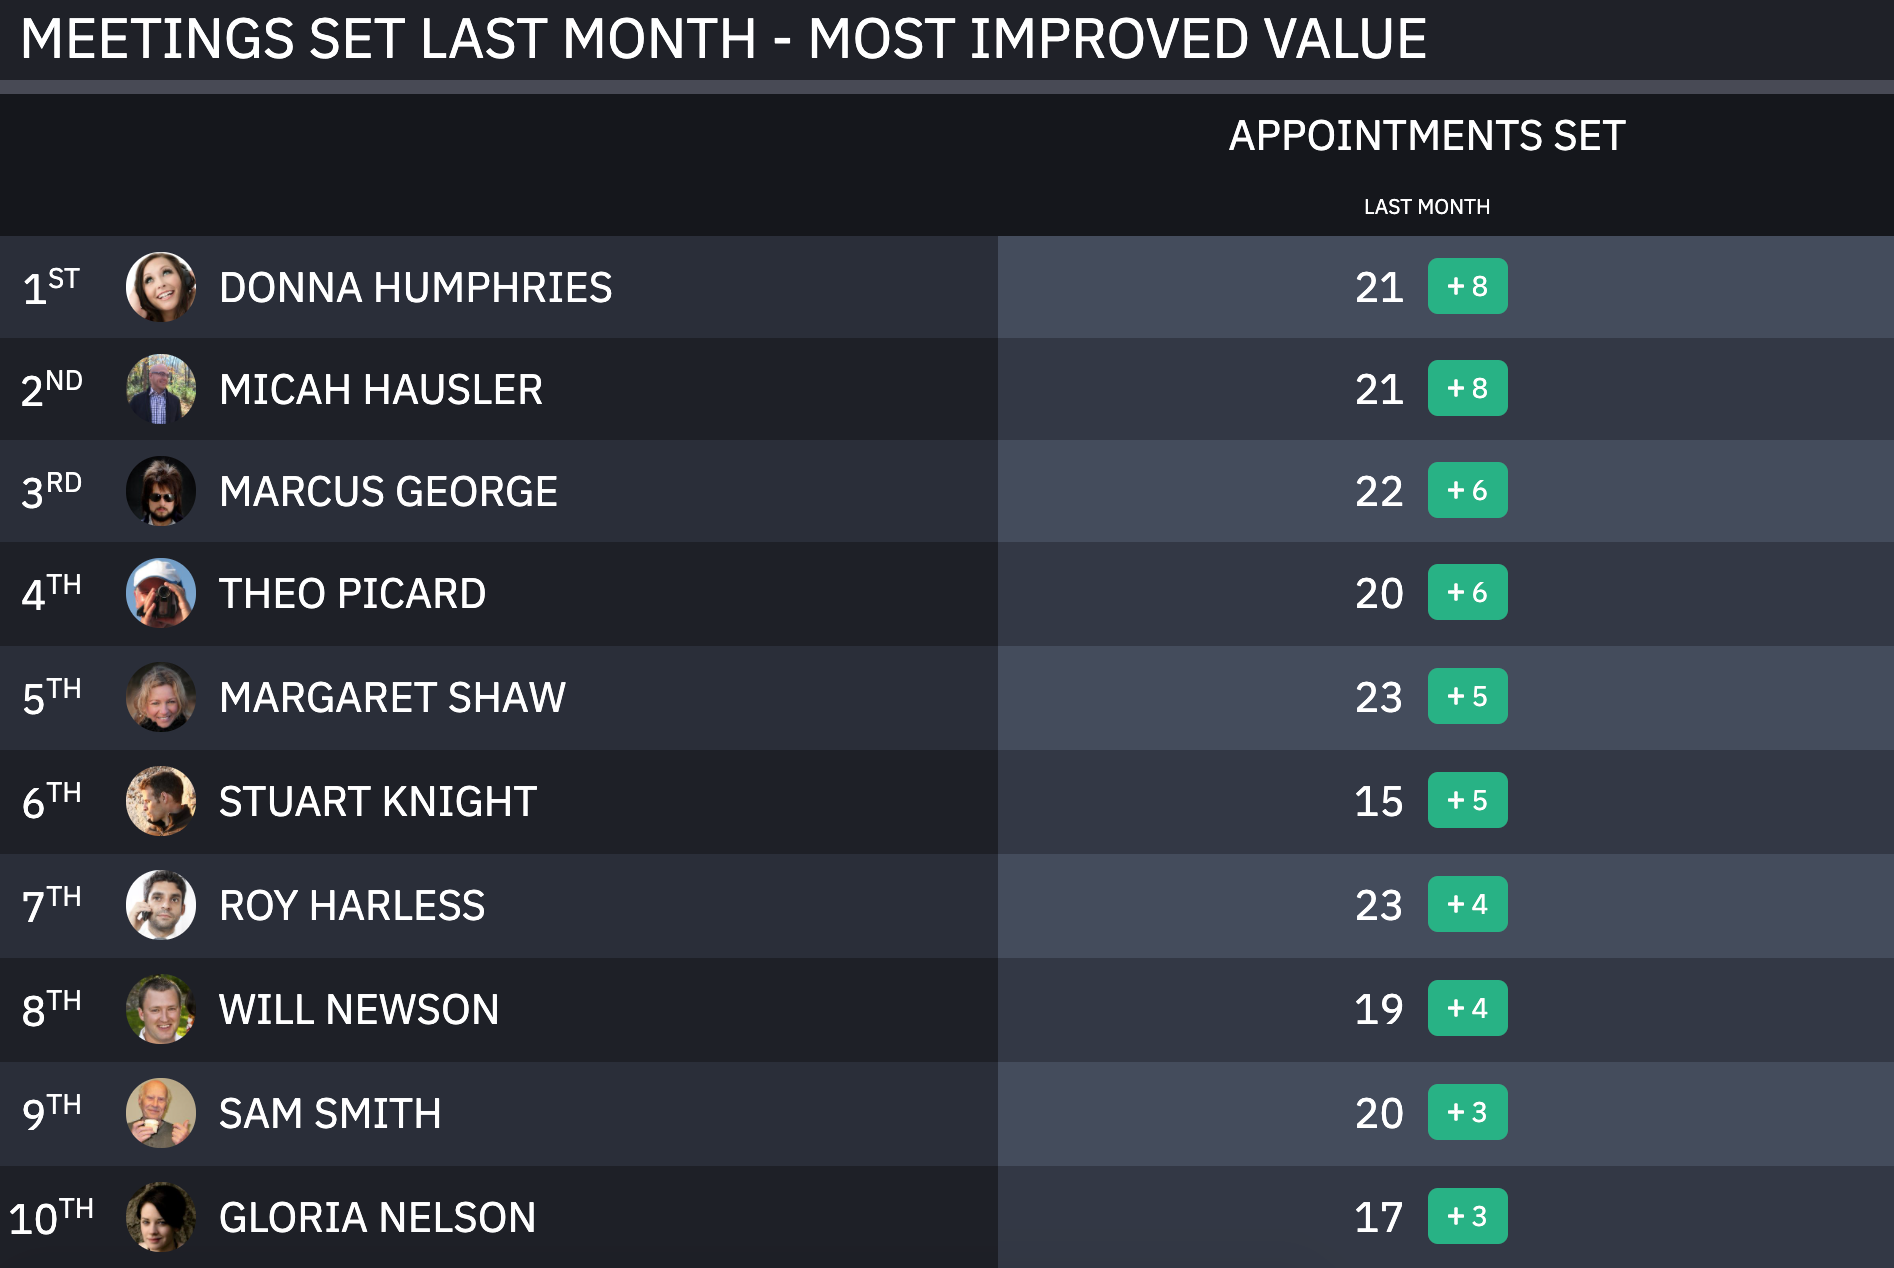 Grid View |
Examples of Most Improved by Rank Leaderboard.
The rank change is listed in green while the the actual metric value is listed in black text.
Ex. Elizabeth Bacon held 22 appointments last month. Ellen's rank went up 95 spots from the previous month.
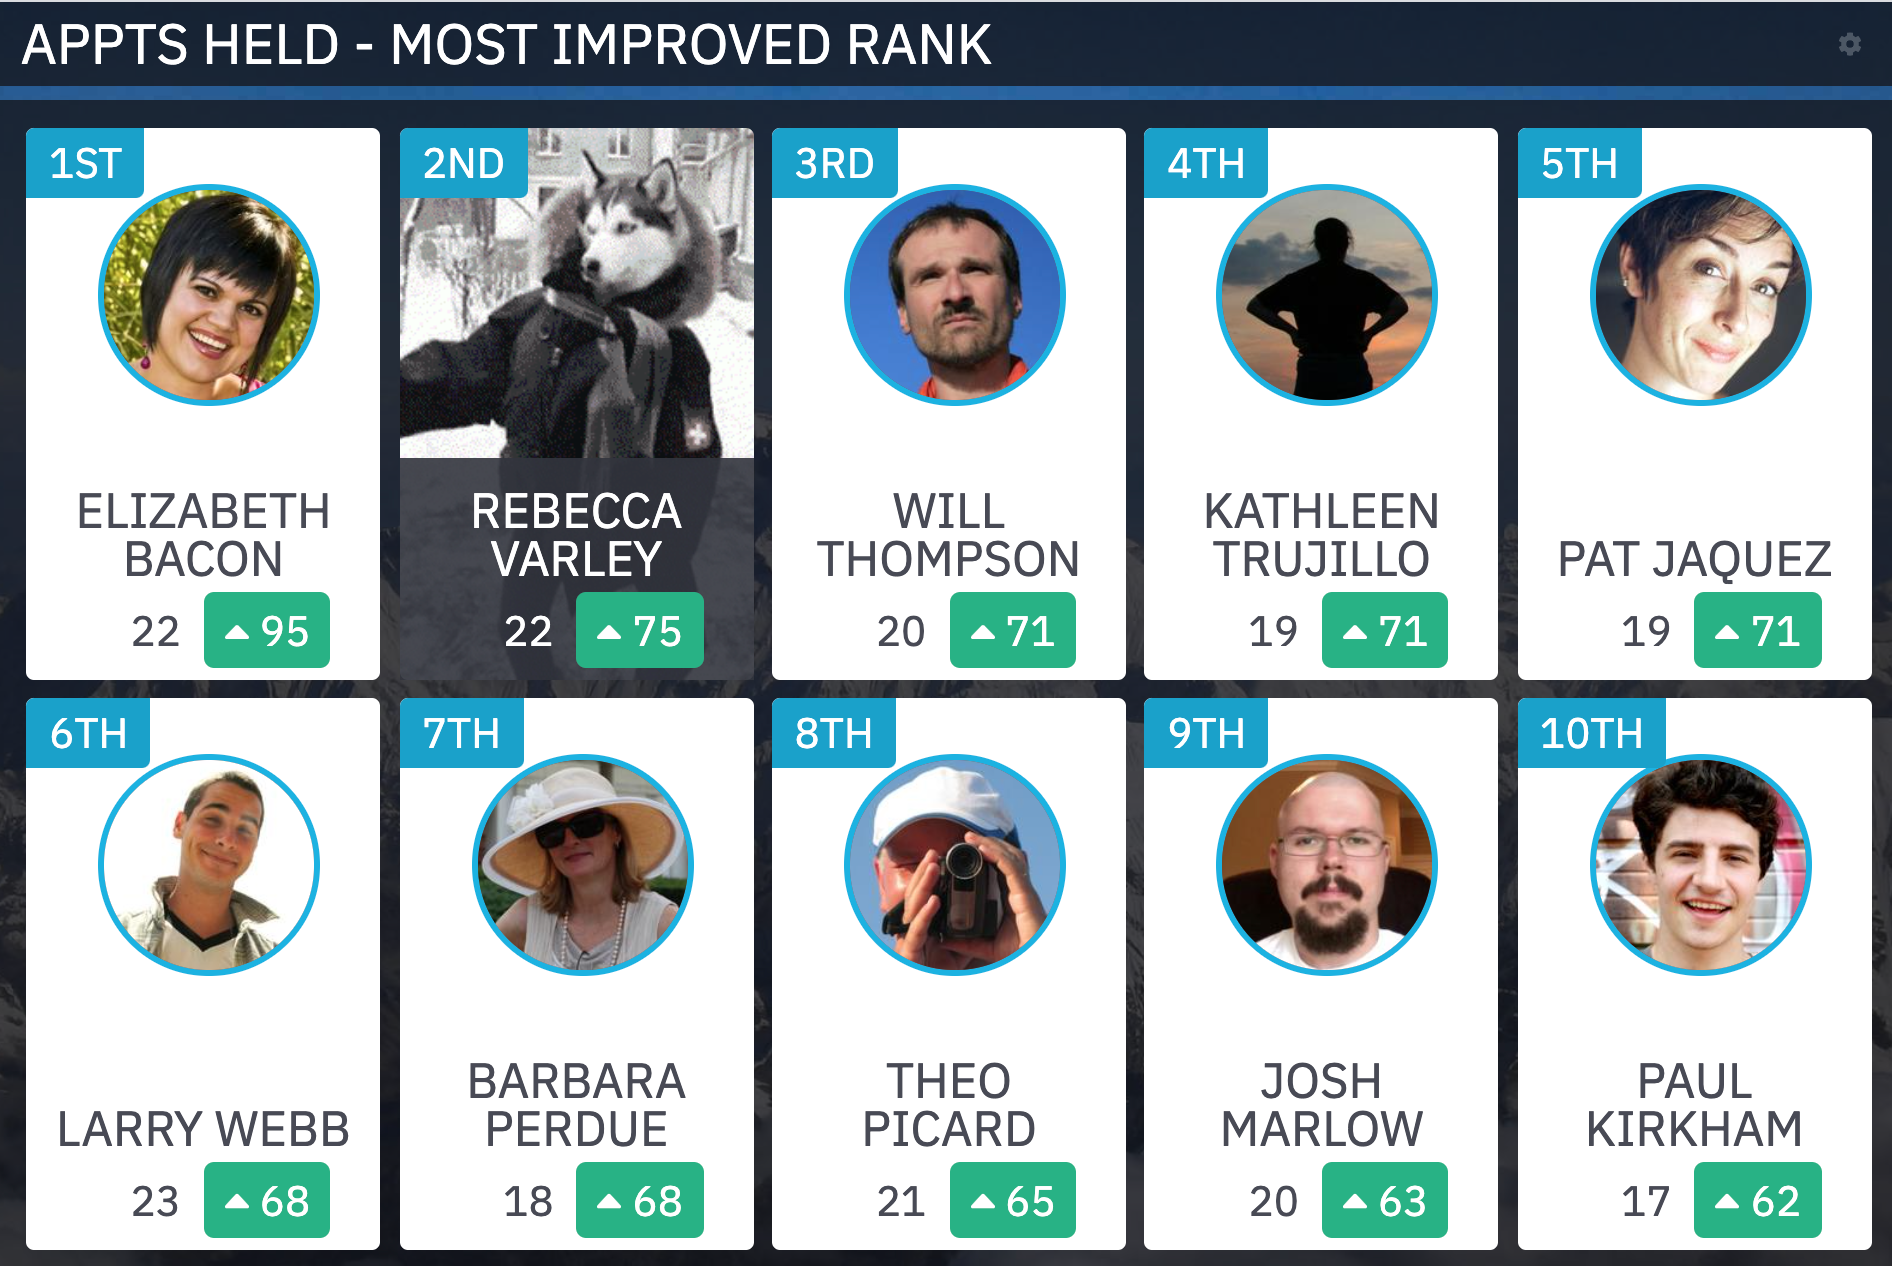 Card View | 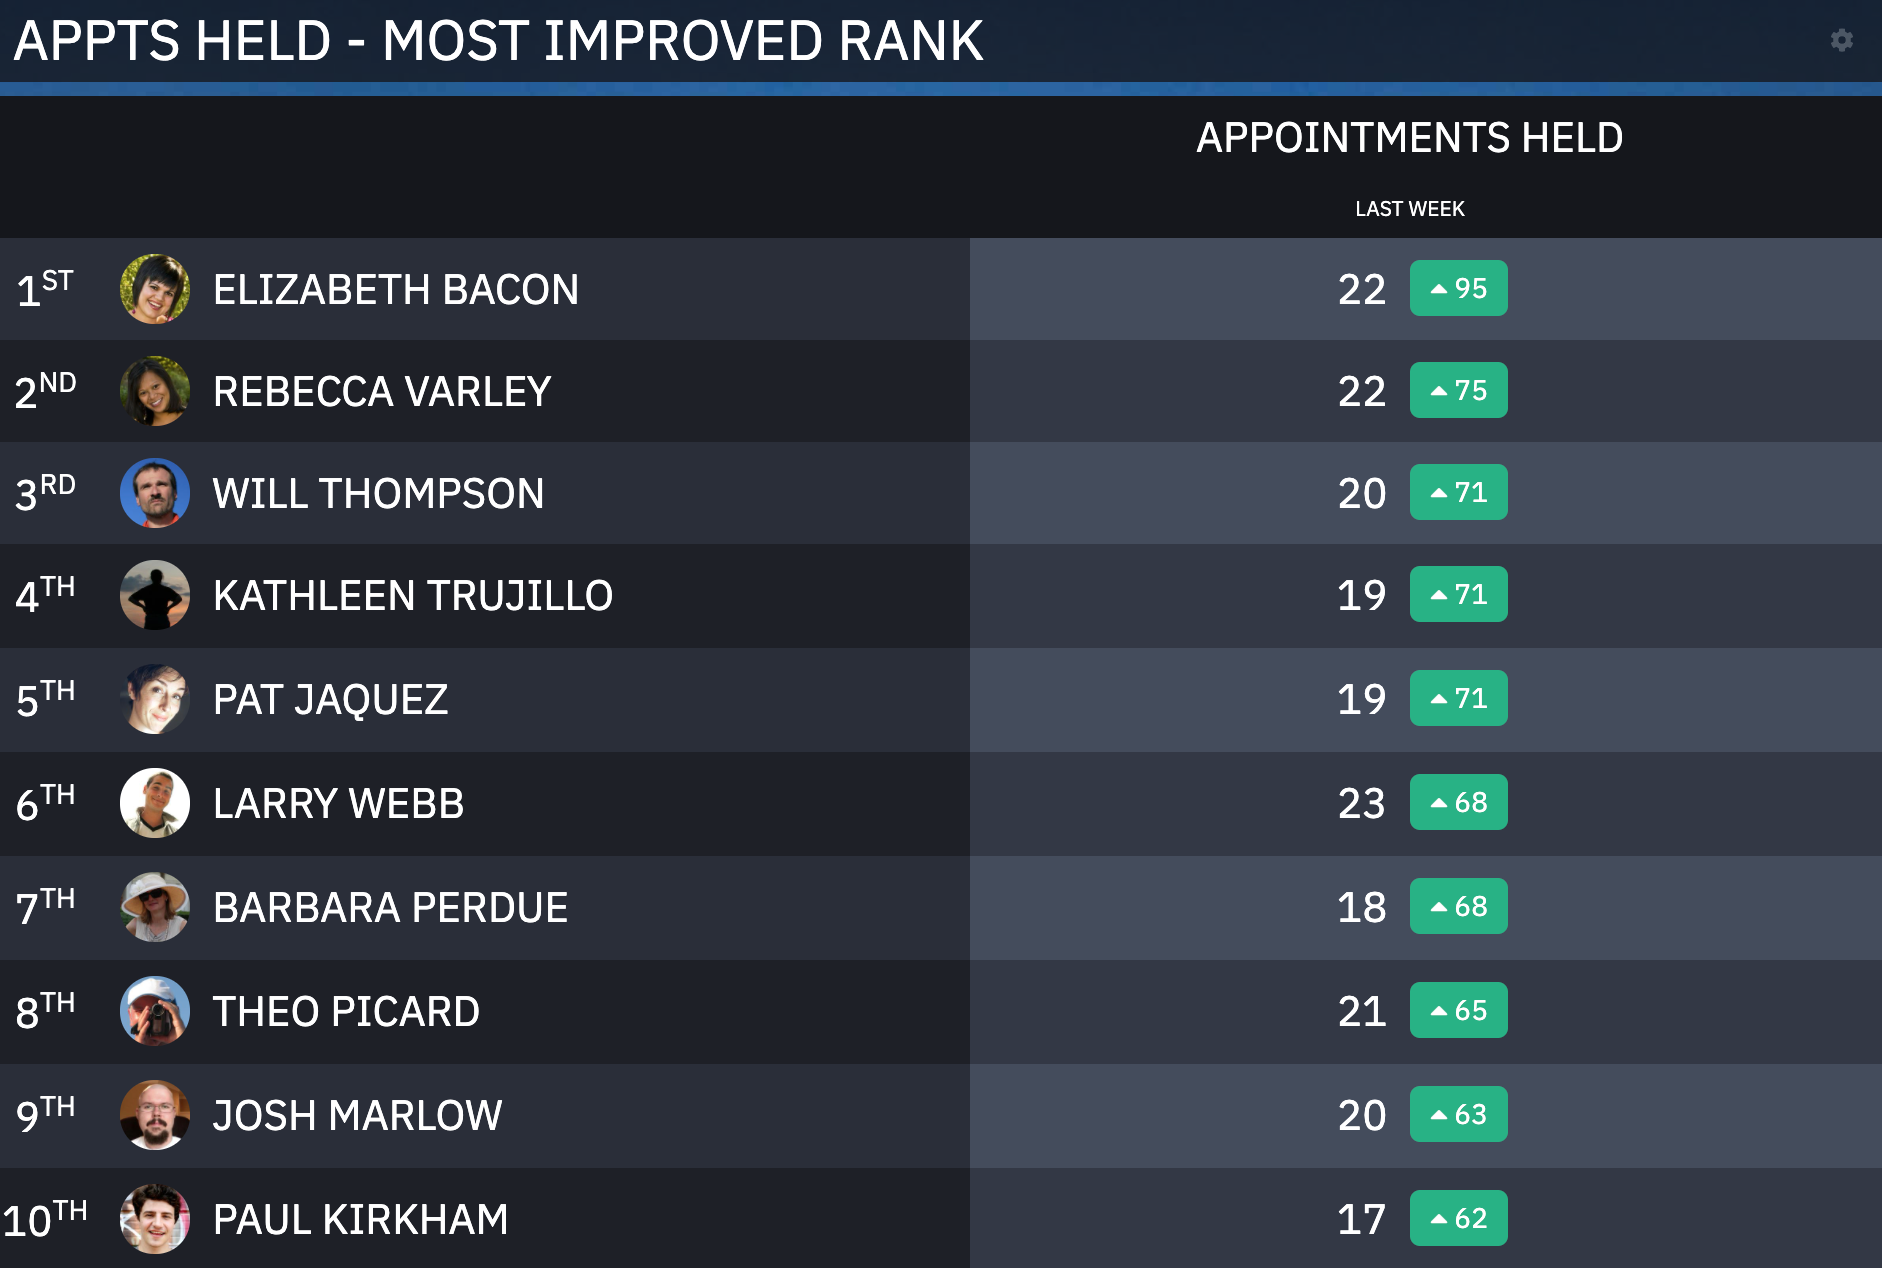 Grid View |
Target Settings
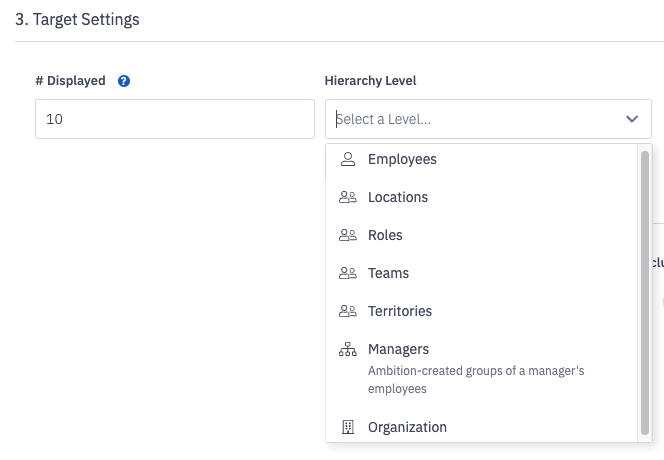
# Displayed: Select the number of users / group to be displayed.
Note: 10 users or groups will display at a time. There will be an additional slide duration for each multiple of 10.
Hierarchy Level: Select the hierarchy level to be displayed on the leaderboard.
Special Note about the Employees > Within Specific Groups > "Manager" Hierarchy Level In Cases where a Manager Manages other Managers.
If Manager A is listed as a Manager B's manager within their User Settings, any of Manager B's direct reports will also be considered as users Manager A manages, or Manager A's subordinates.
Display Settings
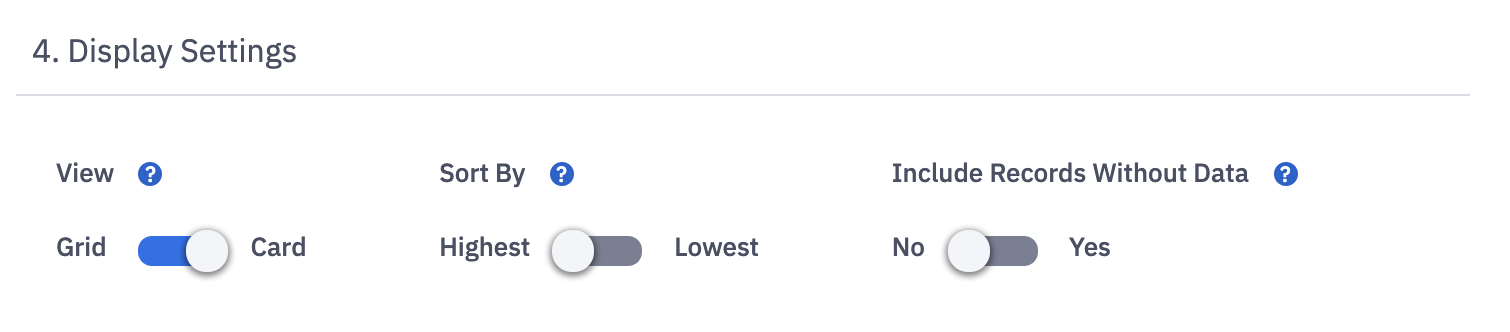
View Grid or Card: Card view is only available for a Leaderboard with one metric selected.
Sort By: Place the highest or lowest achiever in the first rank spot of the leaderboard.
Include Records Without Data: Include users / groups even if they haven't contributed to the selected metric(s).
4. Optionally click the Preview button to preview your leaderboard slide.
Note: Uploaded slide background images will not be viewable through the preview option.
5. Click the Save button.