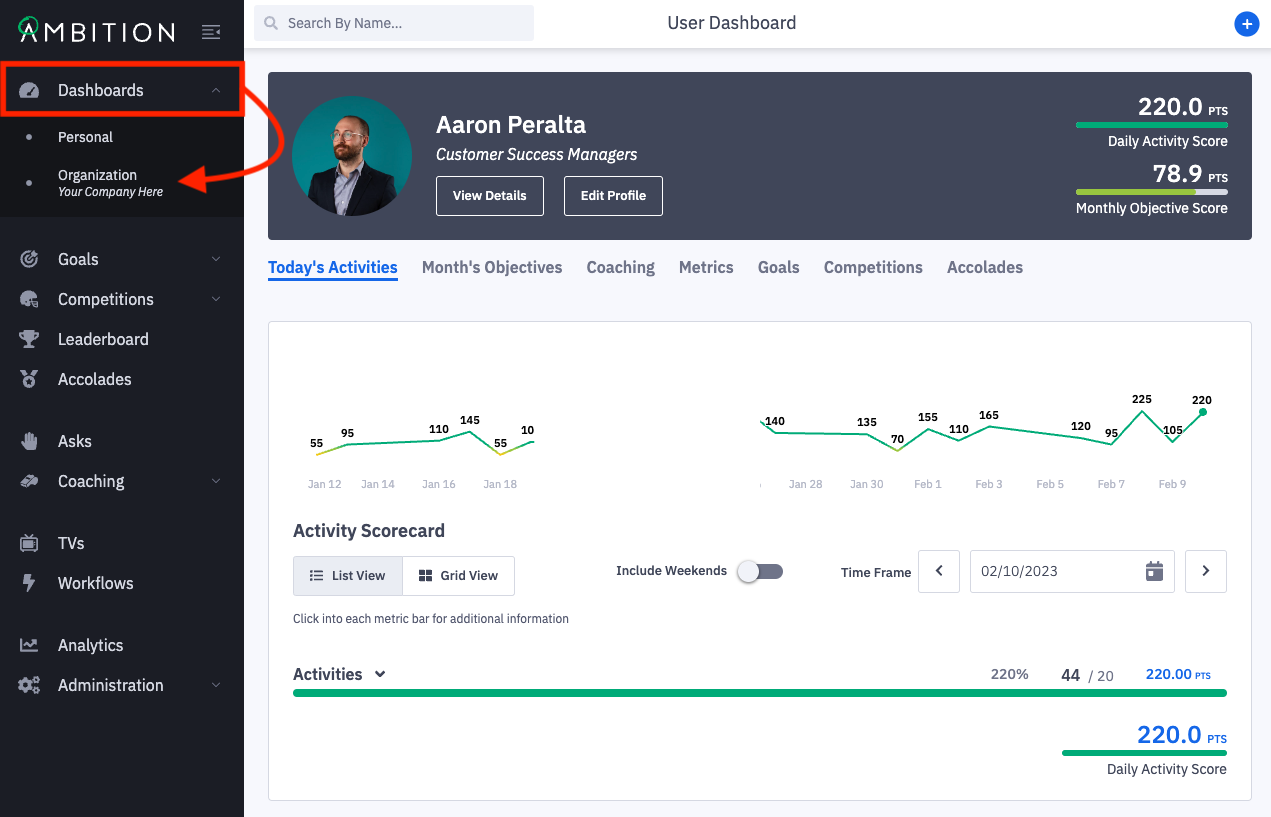
How do I interact with the organization dashboard?
Last updated: August 12, 2025
Organization Dashboard
Access Organizational Dashboard
Access to the Organizational Dashboard is limited to those with the system admin permission.
1. Open the left navigation and select Dashboards > Organization.
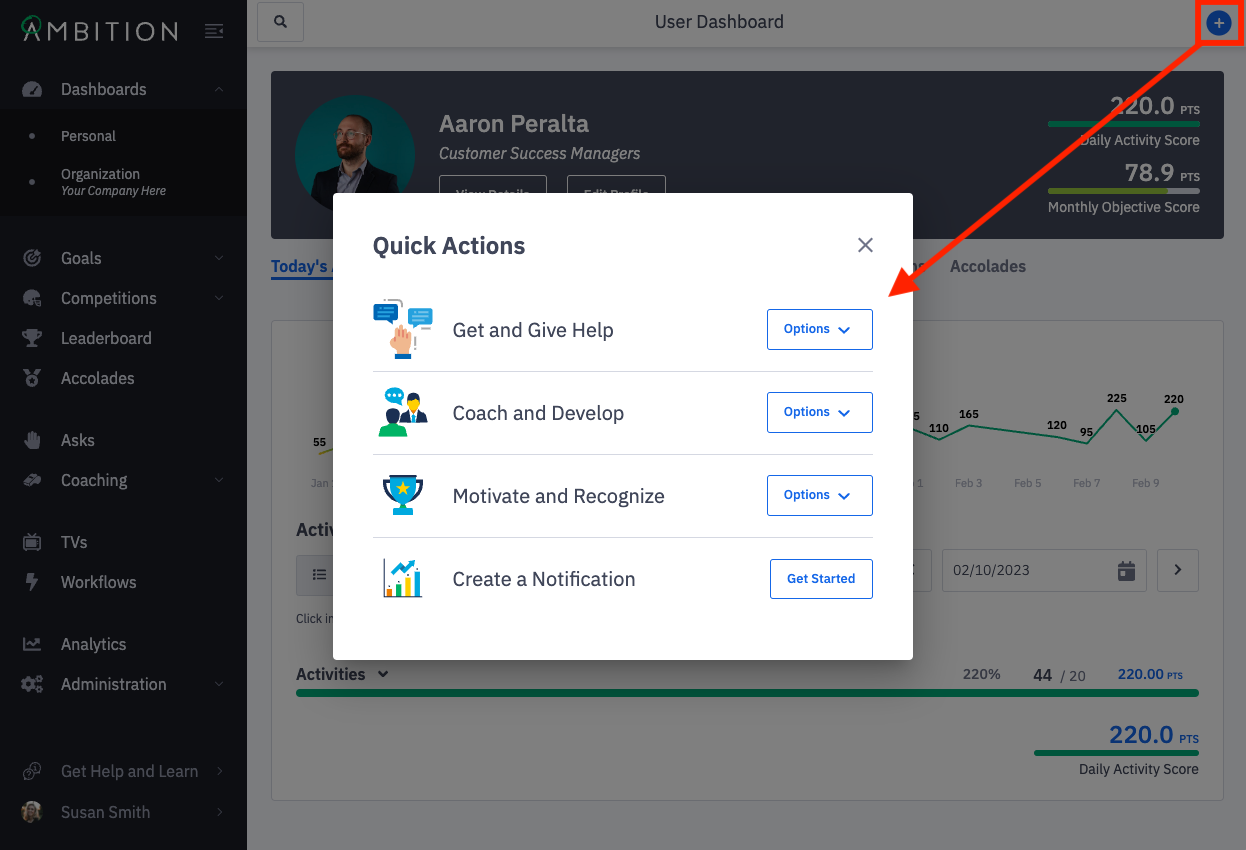
Quick Actions
In the upper right corner of any page in Ambition, you'll find the Quick Actions button.
Clicking the Quick Actions button will reveal a modal which provides quick access to the action you may want to take in Ambition.
The options shown and features you have access to will be dependent on your organization's Ambition package.
Interact with Tabs on Organizational Dashboard

The available tabs will be dependent on the features your organization has enabled.
Scorecard
A scorecard, the Activity and/or Objective tabs, on the organizational dashboard is a cumulative "super-score" of all the active scorecards in Ambition.
A scorecard on the organizational dashboard measures the weighted attainment of all metric targets. Similar to grade-school, these scores are measured on a 0-100+ scale.
A 0-100 scale in conjunction with the red - orange - yellow - green color progression gives you a quick, concise look into your organization's performance.
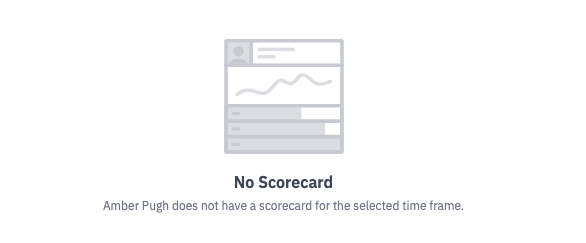
Why is the Organizational Dashboard Scorecard Blank?
If at any point in time you see a blank scorecard like the one below, whether it's the first time you log in or a year later, it's an indication that no scorecards are actively configured in Ambition.
Learn more about creating scorecards here.
Productivity
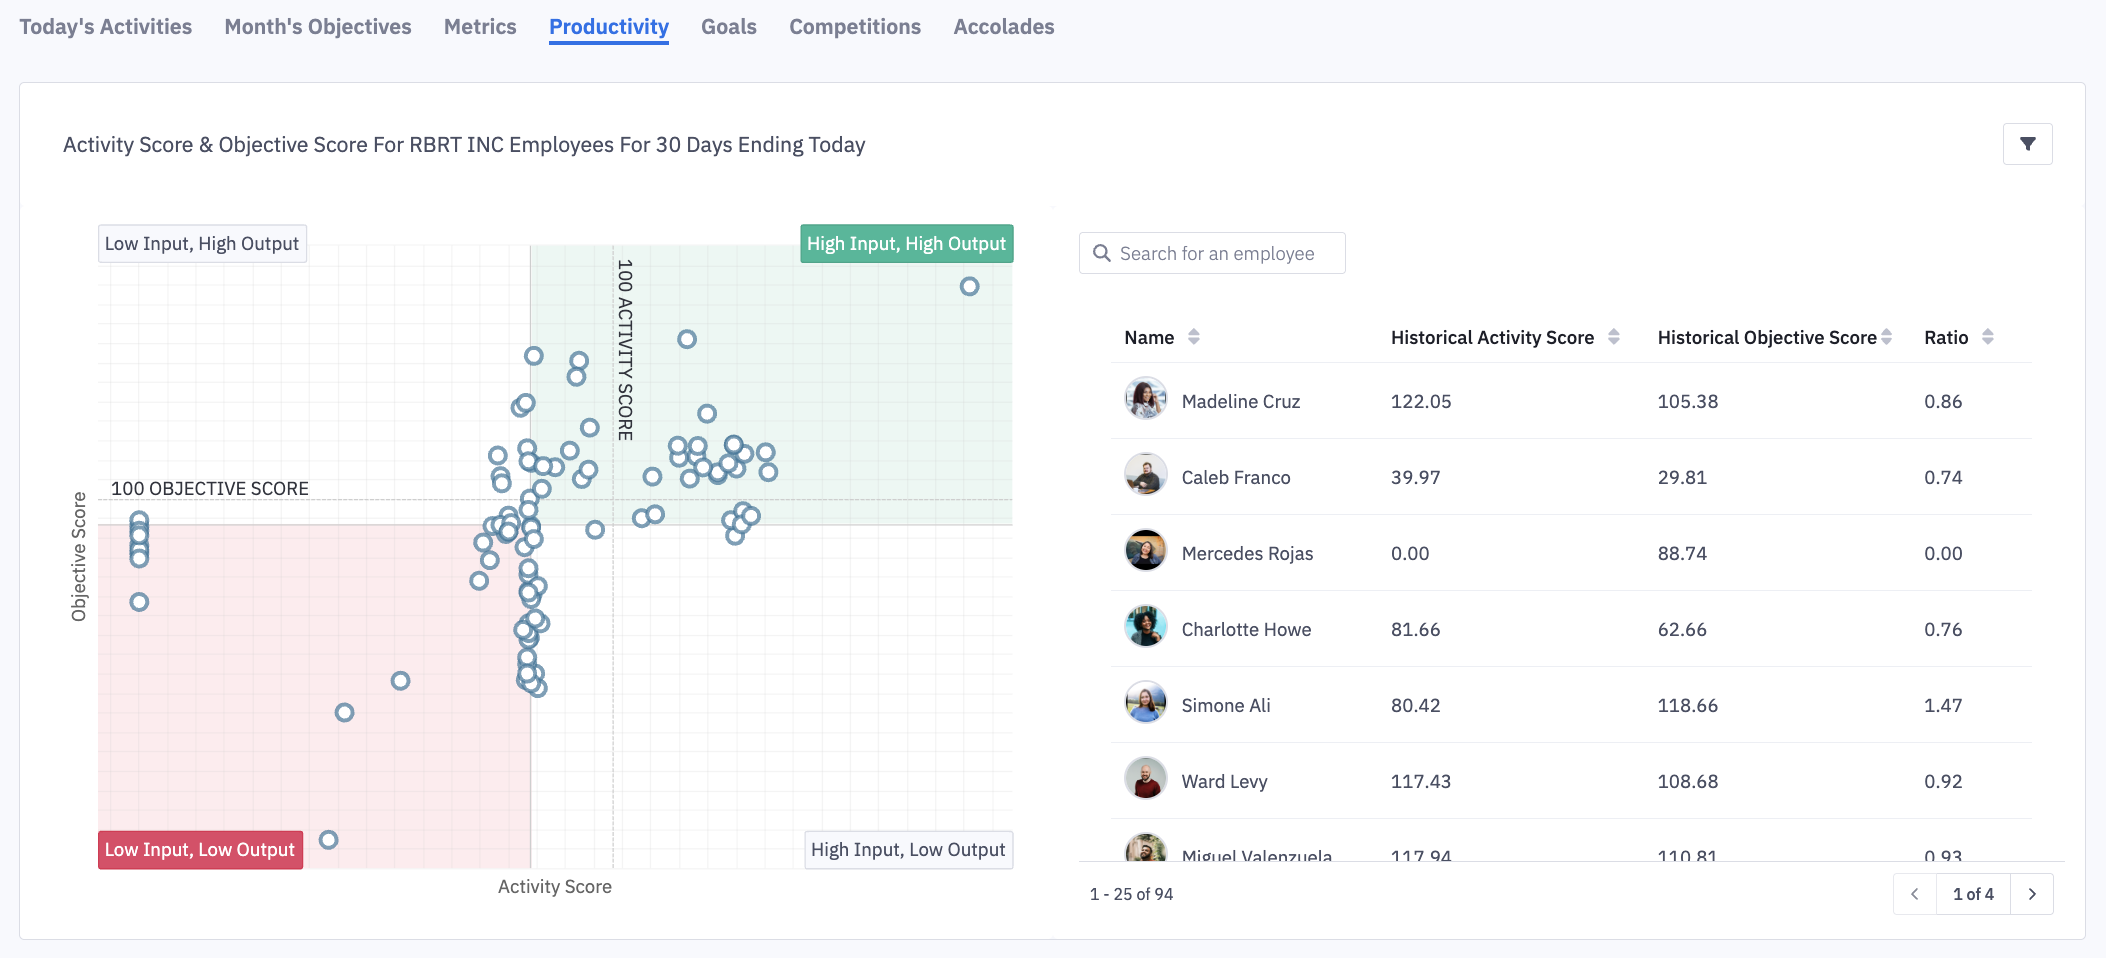
On the productivity quadrant, you can see each of your users based on correlation to their activity and objective scores or any two metrics. The x and y-axis metrics will be selected/updated by clicking on the filters icon.
When comparing activity and objective score, the center is the median of each axis’ values, which designates the red & green areas of the graph.
Each point on the quadrant represents a user. When the point is clicked on you will be able to see: the user's name, historical value for metric one, historical value for metric two, and the productivity ratio.
Learn how the quadrant can help power coaching conversations here.
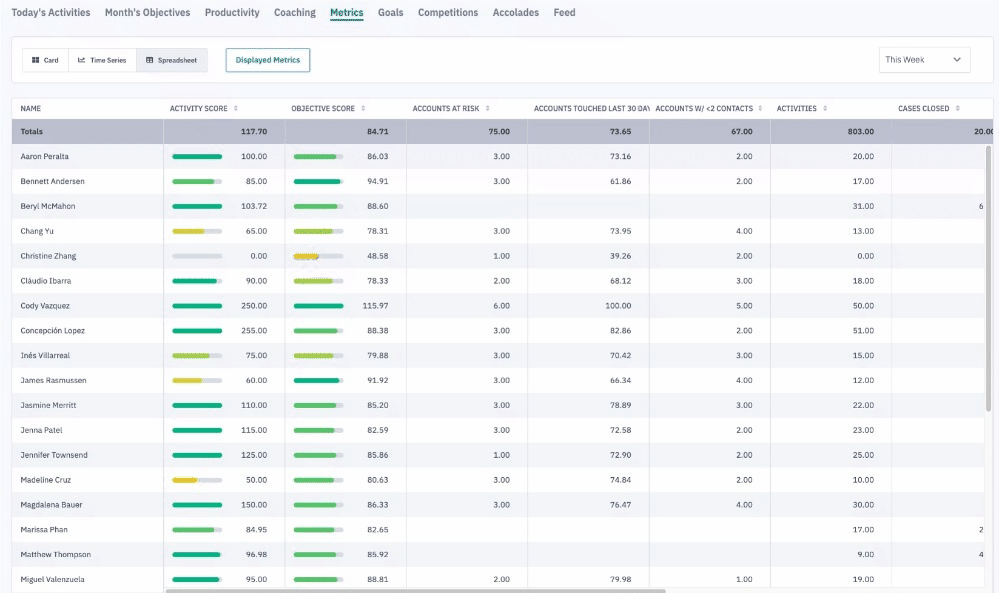
Metrics
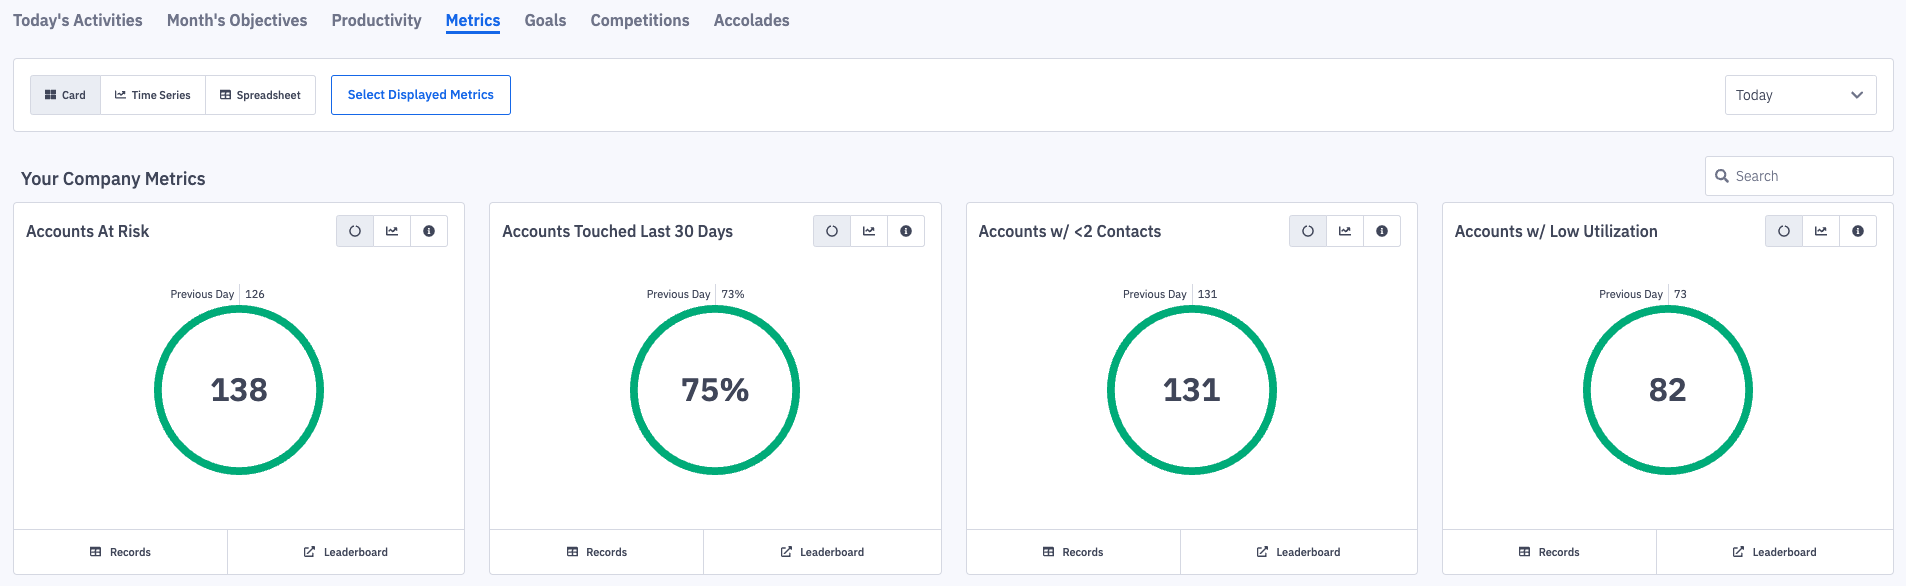
The "Metrics" tab allows you to view contribution towards all other metrics that are not a part of the organization scorecard.
Metrics that are a part of your Activity and/or Objective Score will be selected by default.
If no scorecards have been configured, the first 25 metrics will be selected.
Clicking the Select Displayed Metrics button allows for selecting or unselecting metrics.
To view additional metrics or hide defaults from view:
↳ Click the Select Displayed Metrics button, to view metrics that are not a part of the default metrics.
Scroll and search for metrics you wish to view on your dashboard's metrics tab.
Check the box next to a metric you wish to view on the metrics tab. Uncheck the box next to any metrics you wish to remove from viewing.
Choosing All will display all active metrics your organization has created in Ambition.
If you wish to view selected metrics even if there is no data for the respective time frame, check the box next to Show Metrics Without Data.
Note, these selections do not permanently update the metrics shown as the metrics tab will always revert back to the default metrics.
The values you are viewing will be representative of the time frame selected in the Time Frame drop down in the right corner. ex Today, This Week, Last Month, etc.
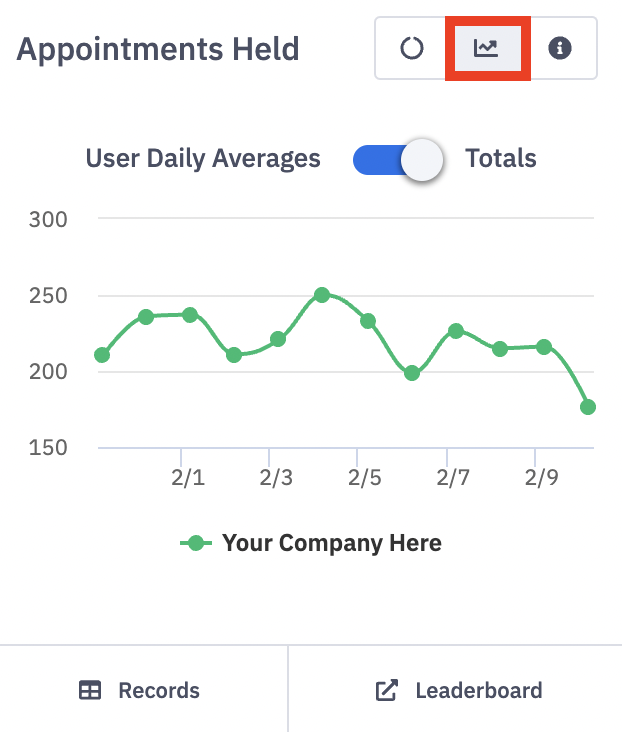
Trends are viewable by clicking the Trends button on each metric card. Here you can view User Daily Averages or Totals.
Clicking Leaderboard a metric card will navigate you into a leaderboard for the respective metric and time frame.
In addition to viewing data in the card view, you can view data in a time series or spreadsheet view as well.
Time Series offers a view into collective metric totals over time periods. Click the Time Series button to view a collective metric value week over week, month over month, etc for all users in your organization.
Metrics that are a part of your Activity and/or Objective Score will be selected by default.
If no scorecards has not been configured, the first 25 metrics will be selected.
Click the Select Displayed Metrics button to customize which metrics you wish to view time series data for.
Alter the time series by updating the Ending time frame and # of days, weeks, months, quarters, or years. If there is no data from a time series, the day, week, month, etc column will not display. Ex. If 6 months from "This Month" is selected, but users in your organization only have data for 3 months, only 3 month columns will display.
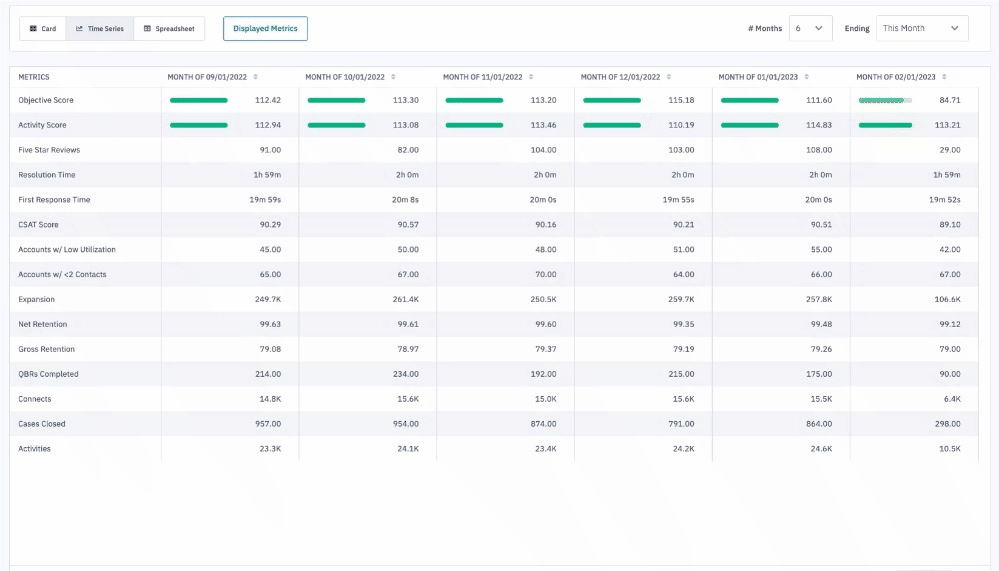
If you wish to set a goal, view individual records that are making up a metric total, or pivot to view individual contribution, hover over a specific cell in the Time Series. After hovering, an ellipses icon will appear through which you can set a Goal (if your package includes Goals), view raw records, or pivot the time series to view user contributions.
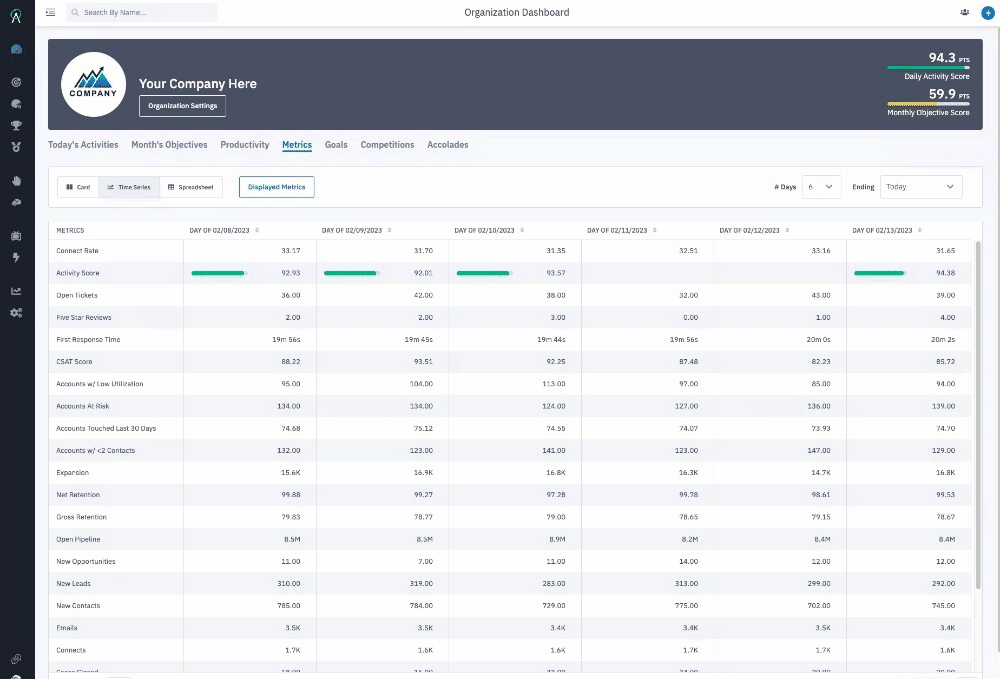
Spreadsheet offers a view into user by user metric totals over time periods. Click the Spreadsheet button to view metric totals by day, week, month, etc.
Metrics that are a part of an Activity and/or Objective Score will be selected by default.
If no scorecards has not been configured, the first 25 metrics will be selected.
Click the Displayed Metrics button to customize which metrics you wish to view spreadsheet data for.
Change the spreadsheet's time frame by selecting a time frame in the upper right corner.
Like time series, you can set a goal by hovering over a cell, clicking on the ellipses icon, and clicking Set Goal (if your package includes Goals).
Goals
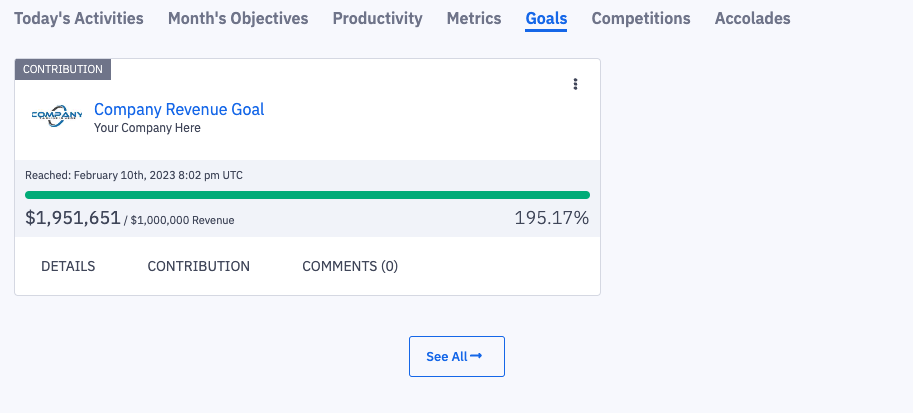
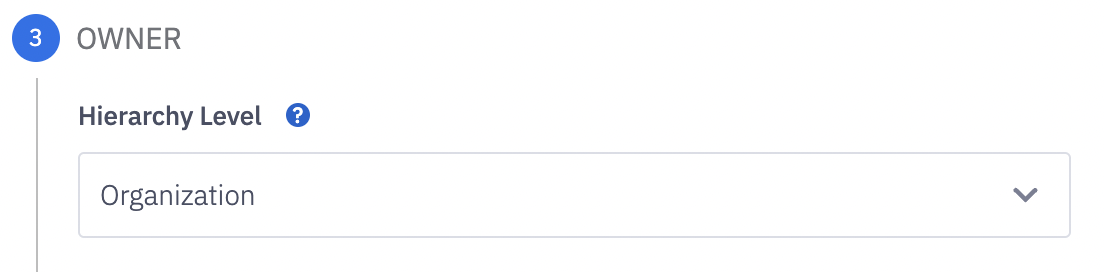
The organizational dashboard will not show all goals for users and/or groups in Ambition, but instead will display goals where the "organization" hierarchy level was selected as the goal's owner.
Learn more about creating goals here.
Competitions
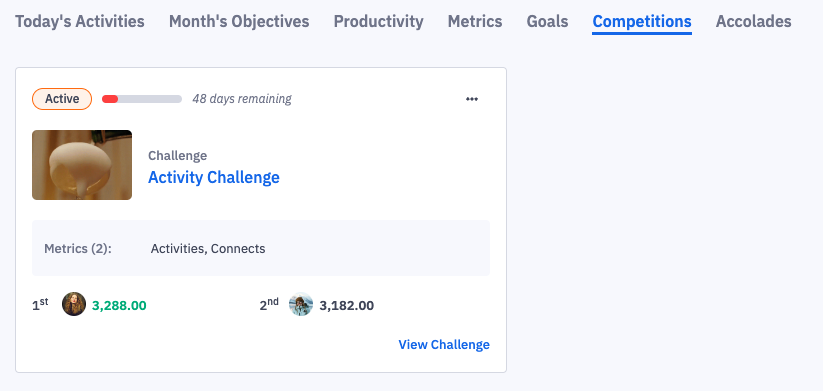
The organizational dashboard will show current competitions that users (competition was created with Hierarchy Level = User) are participating in.
Learn more about accessing competitions here.
Accolades
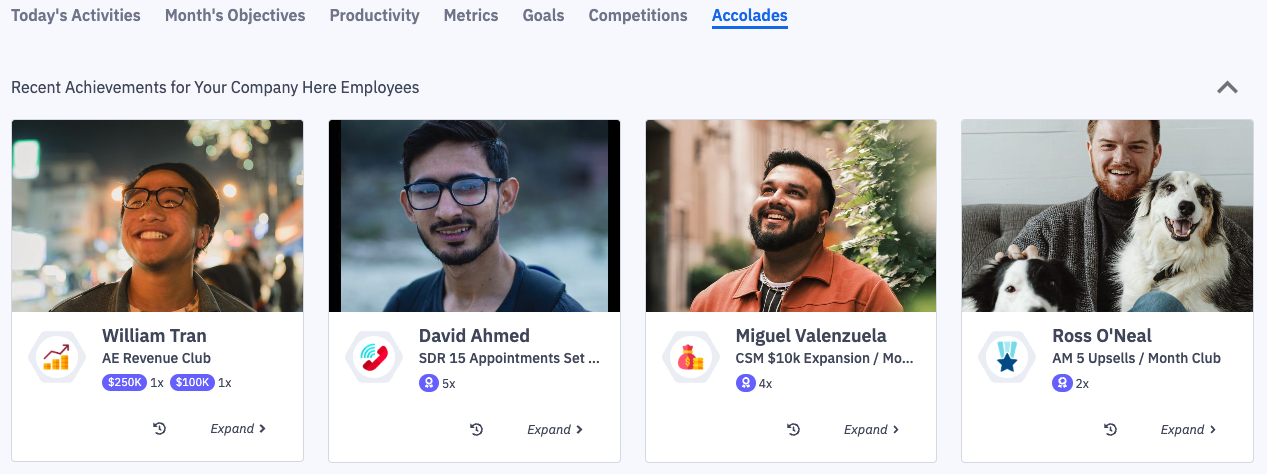
Any accolades that have recently been achieved will be featured on the organizational dashboard.
Learn more about viewing and socially sharing accolades.
Organizational Dashboard Scorecard Calculation
Groups dashboards are perfect for seeing how specific teams, roles, locations, and other groups in Ambition are performing.
However, instead of having to view each individual user’s or group's dashboard, a look at the organizational dashboard can show collective progress.
Ambition compiles data from each user using weighted averages that take into account the varying scorecards, metrics, and targets to generate a collective organizational score.
Learn more about group scorecard calculations and view examples here.